




Ripple and Stellar outlook: XRP and XLM rebound as bearish momentum weakens
- XRP extends recovery on Thursday, up over 2% so far this week.
- XLM steadies at $0.187 after finding support around the $0.177 earlier this week.
- Fading bearish momentum across both altcoins suggests the recovery could extend in the near term.
Ripple (XRP) and Stellar (XLM) trade higher on Thursday as both altcoins extend their recovery after defending key support levels earlier this week. XRP is up more than 2% so far this week, while XLM has rebounded after finding support around $0.177. Improving derivatives metrics and fading bearish momentum indicators suggest the recovery could extend in the near term.
Derivatives metrics show recovery signs
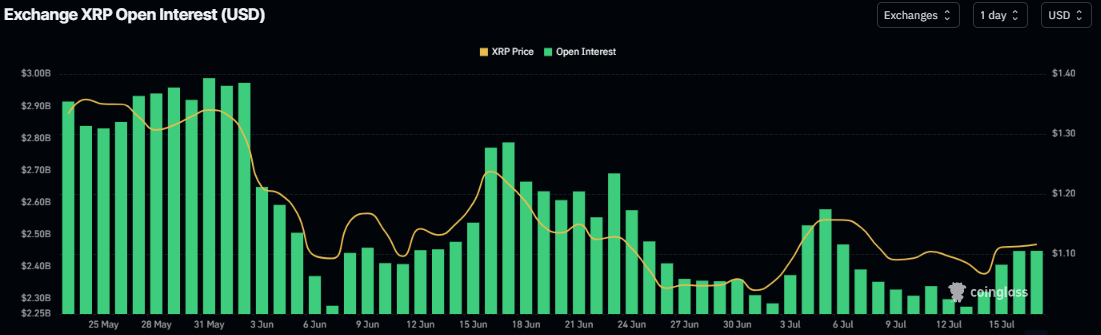
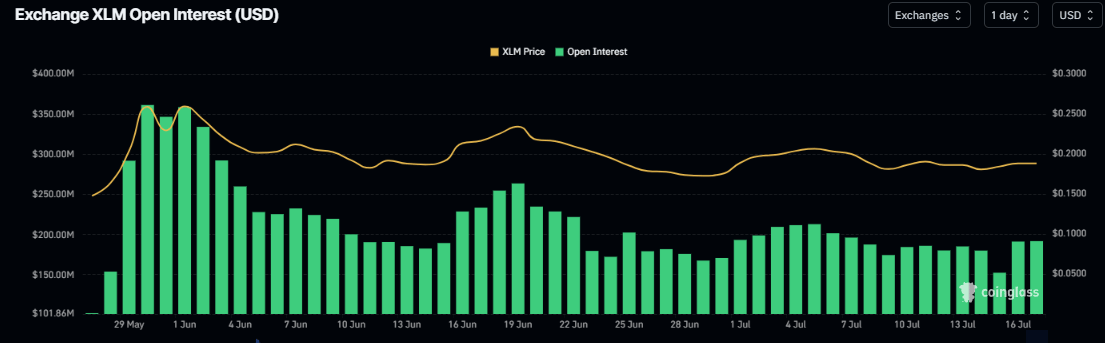
Derivatives metrics show mild signs of improvement for Ripple and Stellar. XRP's futures Open Interest (OI) has risen to $2.45 billion on Thursday after falling to $2.28 billion on Monday. Over the same period, XLM's OI increased to $193 million from Monday's low of $153 million.
This rise in open interest, alongside the recent price recovery, suggests fresh capital is entering the market, indicating improving trader confidence and supporting the case for a further rebound.
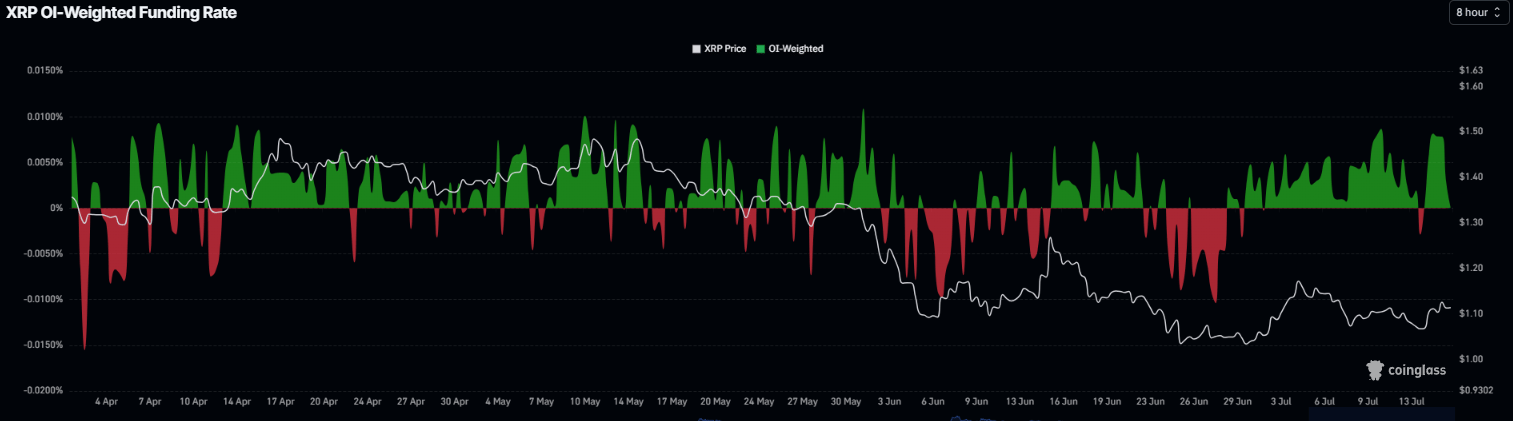
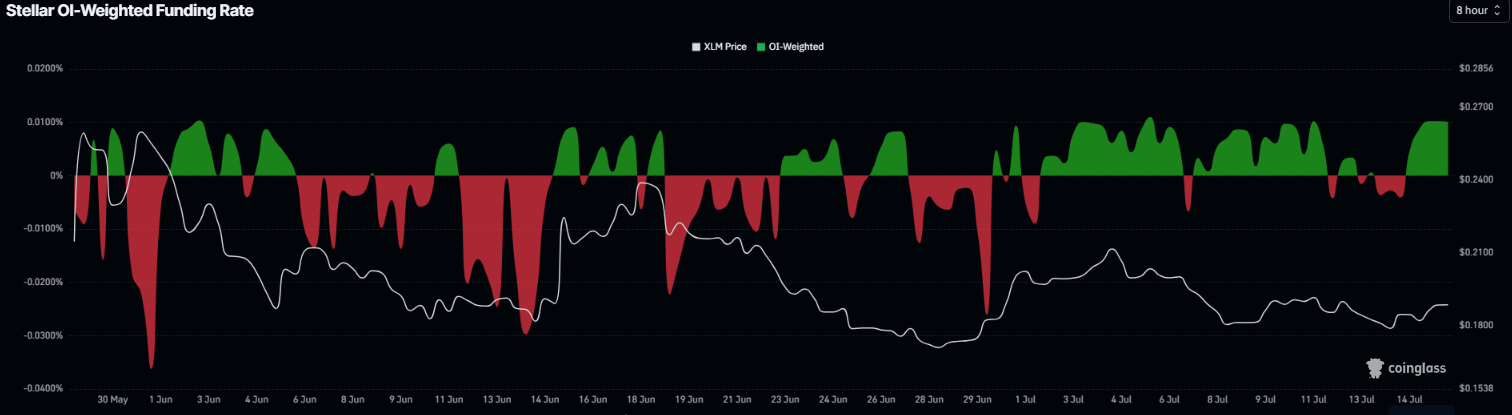
In addition, XRP and XLM funding rates flipped positive on Tuesday, reading 0.27% and 0.0101%, respectively, on Thursday, indicating improving sentiment.
Mixed on-chain metrics
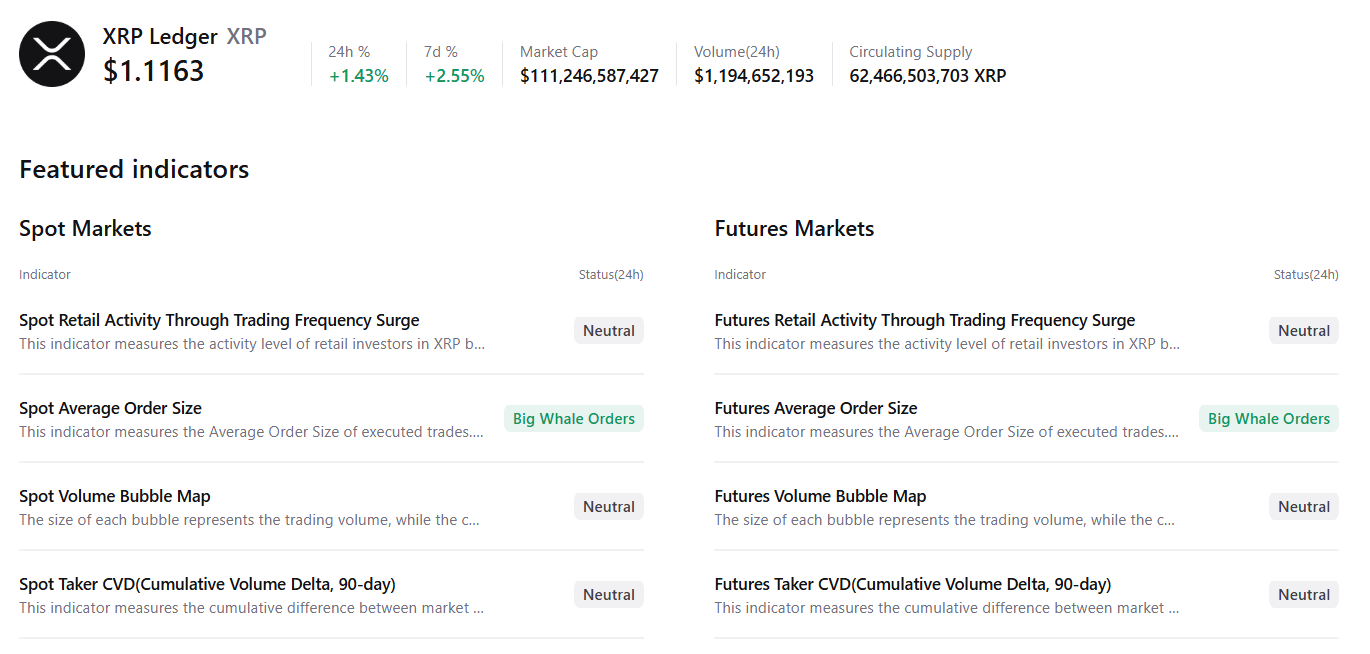
CryptoQuant’s summary data shows mixed sentiment. XRP’s spot and futures markets show large whales' orders with neutral conditions in other metrics, supporting a potential recovery.
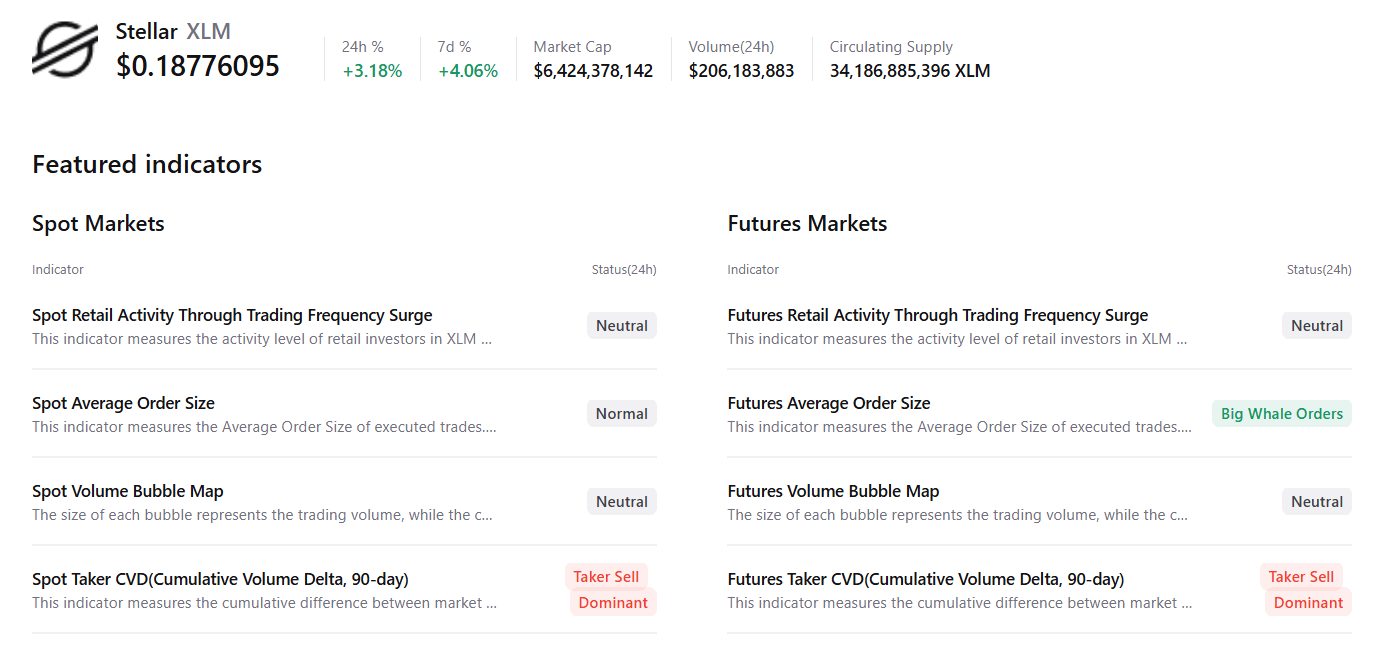
However, XLM shows selling-side dominance in both markets, hinting at cautious sentiment among traders and capping any potential recovery.
XRP technical outlook: Fading bearish strength
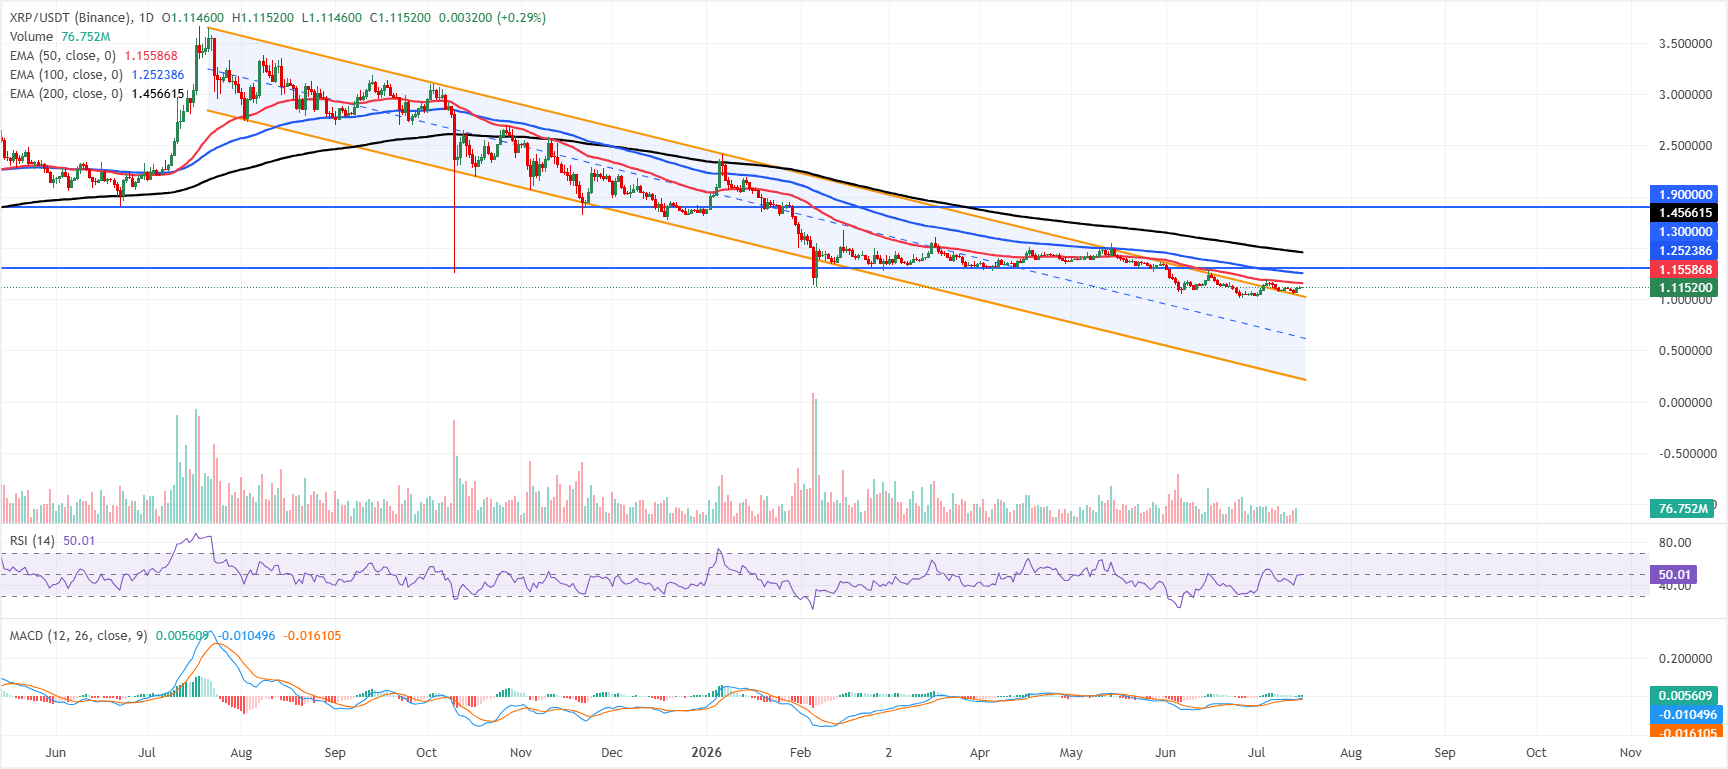
XRP price trades at $1.115 on Thursday, after recovering and finding support around the upper boundary of the downward parallel channel earlier this week. However, XRP is holding beneath the key Exponential Moving Averages (EMAs), which keeps the bias bearish.
XRP price remains below the 50-day EMA at $1.155 as well as the 100-day EMA at $1.252 and the 200-day EMA at $1.456, suggesting rallies are still being capped by overhead trend resistance. Momentum is more balanced, with the Relative Strength Index (RSI) hovering near the neutral 50 mark and the Moving Average Convergence Divergence (MACD) marginally positive, hinting at stabilizing downside pressure rather than a clear bullish reversal.
On the topside, immediate resistance appears at the 50-day EMA around $1.155, followed by the 100-day EMA at $1.252 and the horizontal barrier near $1.300. At the same time, a stronger supply zone is seen higher up at the 200-day EMA at $1.45 and the prior resistance line around $1.900.
On the downside, initial support is aligned with the lower boundary of the prevailing downward parallel channel near $1.027, where buyers have some room to respond before a deeper decline would reinforce the broader bearish structure.
XLM technical outlook: Finds support around key support zone
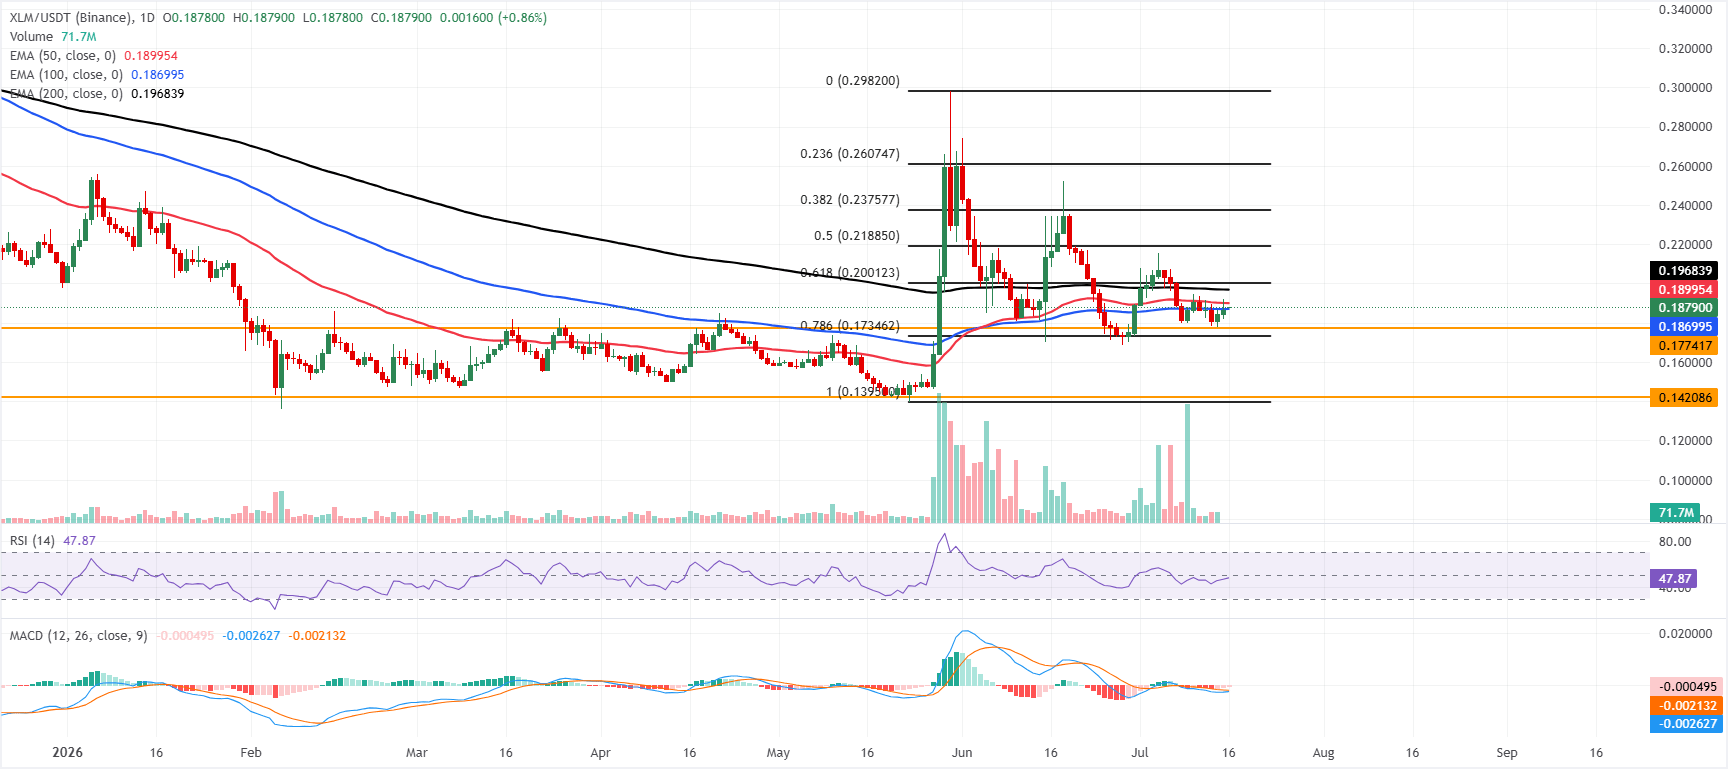
XLM price trades at $0.187 on Thursday, holding below the 50-day EMA at $0.190 and the 200-day EMA at $0.196, which keeps the pair in a capped, mildly bearish bias despite trading just above the 100-day EMA at $0.187.
The RSI around 48 hints at neutral-to-soft momentum, while the MACD remains slightly negative, suggesting that buyers lack conviction to challenge the overhead EMAs and Fibonacci barriers for now.
On the topside, initial resistance is seen at the 50-day EMA at $0.190, followed by the 200-day EMA at $0.196 and the 61.8% Fibonacci retracement at $0.200, with stronger supply layered higher at the 50% retracement at $0.218 and the 38.2% Fibonacci retracement level at $0.237.
On the downside, immediate support comes from the 100-day EMA at $0.187, ahead of the horizontal floor at $0.177 and the 78.6% Fibonacci retracement at $0.173, while a deeper pullback would expose the next key base near $0.142.
(The technical analysis of this story was written with the help of an AI tool. Know more.)
Recommended Articles


