


Dow Jones Industrial Average futures round-trip rally as chip bounce fades into CPI
- The Dow erased a strong early advance and reversed lower as the semiconductor rebound lost momentum.
- Cheaper Crude Oil and firm housing data gave equities an early lift that did not stick.
- Tomorrow's CPI release headlines a heavy inflation calendar, and traders are cutting risk into it.
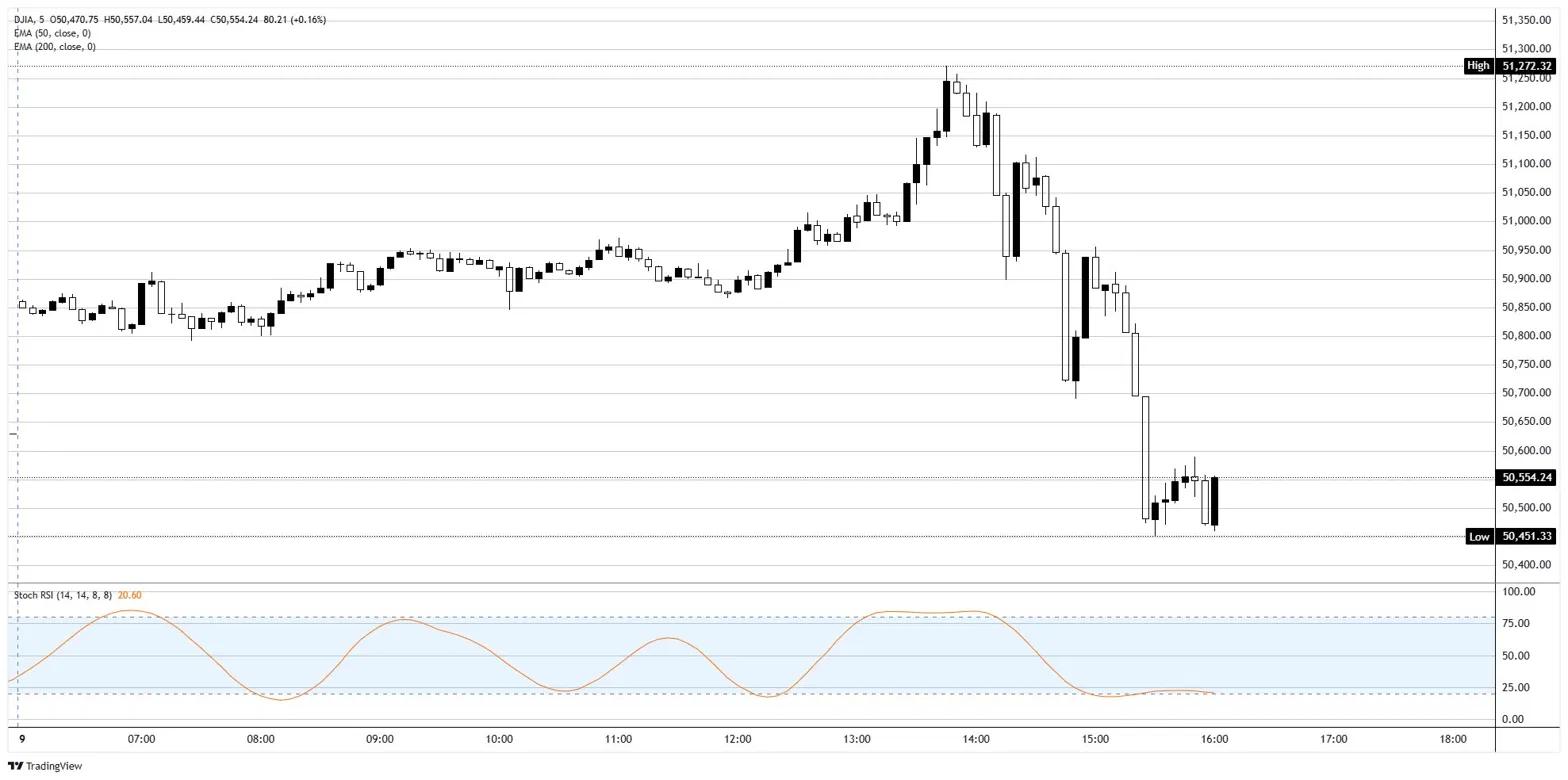
The Dow Jones Industrial Average (DJIA) spent Tuesday proving that a one-day bounce is not the same as a bottom. Futures pushed higher through the overnight and premarket sessions, carried by a rebound in semiconductors and a softer Crude Oil tape, climbed into the early afternoon, then ran straight into a wall. From a session high near 51,250 the index unwound roughly 820 points to a low around 50,450 before steadying close to 50,500, leaving the day's rally as little more than a round trip. For an index that owns almost none of the chip names doing the heavy lifting elsewhere, that is the familiar trap: when the broad tape turns, the Dow gets dragged along whether its components deserve it or not.
A chip rebound with a short shelf life
Monday's rebound in the major semiconductor exchange-traded fund (ETF) had the look of a dead-cat bounce, and Tuesday confirmed it. The fund gave back close to 4% after Monday's near 6% pop, itself a reflex off the worst session for chips in years last Friday. The market wants to treat that washout as capitulation and the bounce as a bottom, but the buyers keep failing to follow through. The deeper issue is rates: Friday's much stronger than expected Nonfarm Payrolls (NFP) report jolted Treasury yields higher and nudged the odds of further Federal Reserve (Fed) tightening up, and an artificial intelligence trade built on cheap money and heavy borrowing does not enjoy that backdrop. The Dow is not a chip index, but it cannot escape the gravity when the leaders roll over.
Cheaper Crude Oil, no buyers for the story
The early bid had a second leg that should have lasted longer than it did. West Texas Intermediate (WTI) Crude Oil fell about 4% to trade under $90 a barrel after US officials flagged a meaningful pickup in Strait of Hormuz shipping traffic, and President Trump floated the prospect of a US-Iran deal within a few days that would reopen the strait immediately. Lower energy costs are usually a tailwind for the broad market, and the session even had a genuinely strong data point to lean on, with existing home sales jumping 3.2% on the month and topping forecasts. None of it held the bid. Energy shares sagged alongside the Crude Oil price, and the rest of the tape decided it had bigger things to worry about than cheaper gasoline.
The bubble-top whispers get louder
What it is worried about is whether the whole artificial intelligence engine is running hot. OpenAI confidentially filed for an initial public offering (IPO) late Monday, and SpaceX is lined up for the largest IPO ever this Friday at a valuation north of $1.75 trillion. Bulls read that as more fuel for the trade; a growing camp reads it as the kind of supply that shows up near a top. With valuations stretched and the chip complex wobbling, the second interpretation had the upper hand on Tuesday afternoon.
CPI is the print nobody wants to front-run
The bigger reason the rally got sold is sitting on tomorrow's calendar. The May Consumer Price Index (CPI) is the week's marquee red-band release, and the consensus does the market no favors. Headline CPI is seen accelerating to 4.2% YoY from 3.8%, with the monthly pace at 0.5% and core holding firm near 2.9% YoY. After a hot jobs report and with rate-hike odds creeping higher, a print that confirms re-acceleration is exactly the wrong news for equities, the classic case where firmer data reads as a threat rather than a comfort. Producer Price Index (PPI) figures follow Thursday and the preliminary University of Michigan sentiment survey closes the week Friday, but CPI sets the tone. With that overhead, trimming risk into the close is less about conviction and more about not wanting to hold the bag if the number runs hot.
Trading framework
Upside: a reclaim of 51,000 puts the session high near 51,250 back in play, and only a push through the 51,400 area reopens the record-chase narrative.
Downside: losing the 50,450 low exposes the 50,000 handle, with the daily 50-period Exponential Moving Average (EMA) near 49,650 as the next meaningful shelf.
Bias: neutral to bearish into CPI. The failed breakout and the daily Stochastic Relative Strength Index (Stoch RSI) rolling over from elevated territory argue for caution, and a hot inflation print would likely do the rest. A soft surprise is the bulls' escape hatch, but that is a coin flip nobody on the desk wants to call the night before.
Dow Jones 5-minute chart
Futures FAQs
The futures market is an exchange-based auction in which participants buy and sell contracts of an underlying asset at a predetermined future date and price. The set price is agreed upon today and is derived from the underlying asset. Futures contracts can be based on a wide range of assets, with commodities among the most popular, although currencies and indices are other common underlying assets. Futures prices depend on their underlying asset and act as a mechanism for firms, institutions, and large-position traders to manage risks through hedging.
Futures can be traded in different ways. The most common ways are via a regulated exchange or via Contracts For Difference (CFDs). In the former, liquidity is high and pricing is more transparent, with the broker serving only as an intermediary between you and the market. Still, it generally requires more capital. The largest futures exchanges are the Chicago Mercantile Exchange (CME) and the New York Mercantile Exchange (NYME). As for CFDs, these require less capital and thus trading is more flexible, but at the cost of less transparency.
The E-mini S&P 500 index, Crude Oil (Brent, WTI), Natural Gas, Gold, Silver, Copper, and soft commodities such as grains are among the most actively traded contracts. These offer strong liquidity and are closely followed by traders worldwide. Futures market volume consistently exceeds spot market volume, often significantly. This dominance is driven by leverage, hedging, and higher liquidity on exchanges.
Yes. Future gauges, particularly equity index futures such as those of the S&P 500 or the Nasdaq, are widely considered key gauges of market sentiment because they reflect investors’ expectations for the next session’s opening price. When equity futures drop, it is a sign of risk-aversion, signaling bearish market sentiment. On the contrary, rising equity futures suggest markets are risk on.
As a futures contract approaches its maturity date, the futures price converges upon the spot price, becoming almost identical at expiration. However, prices can diverge significantly before the contract ends. A market is in contango when future prices are higher than spot prices, while the mirror image is called backwardation (when current prices are higher than future prices). For commodities, the normal state of the market is contango because holding the asset over time incurs costs such as storage or insurance fees. When markets turn from contango to backwardation – or vice versa – it signals a shift in the trend: a change from contango to backwardation is taken as a bullish sign, while going from backwardation to contango is generally considered bearish.
Recommended Articles


