




USD/JPY Price Forecast: Eases to 163.50 with the broader bullish trend intact
- USD/JPY pulls back from 40-year highs just below 165.00 and returns to the 163.50 area.
- The decline responds to USD's weakness on risk-on markets, rather than JPY strength.
- Key support is at the 162.80 area.
The Japanese Yen (JPY) pares recent losses against the US Dollar (USD) on Monday, favoured by a relief rally, as the US and Iran halted their hostilities, opening the door for further negotiations. The USD/JPY pair has pulled back from fresh 40-year highs right below 164.00, but it remains contained at the 163.50 area, keeping the broader bullish trend intact.
The recent JPY recovery has more to do with short-covering of long US Dollar positions, amid fresh hopes of a peace process in the Middle East than with intrinsic Yen strength. Apart from that, investors are likely to remain wary of placing large directional positions in the pair, awaiting interest rate decisions by the Federal Reserve (Fed) and the Bank of Japan later this week.
Analysts at MUFG observe that the “drop in energy prices at the start of this week has brought some much-needed relief for Japanese policymakers and helped to slow upward momentum for USD/JPY.” However, they caution that this respite may be temporary, warning that “without hawkish guidance (by the Bank of Japan), the yen is vulnerable to further weakness, especially if the Fed delivers a hawkish policy surprise this week.”
Technical Analysis: Key support lies at the 162.80 area
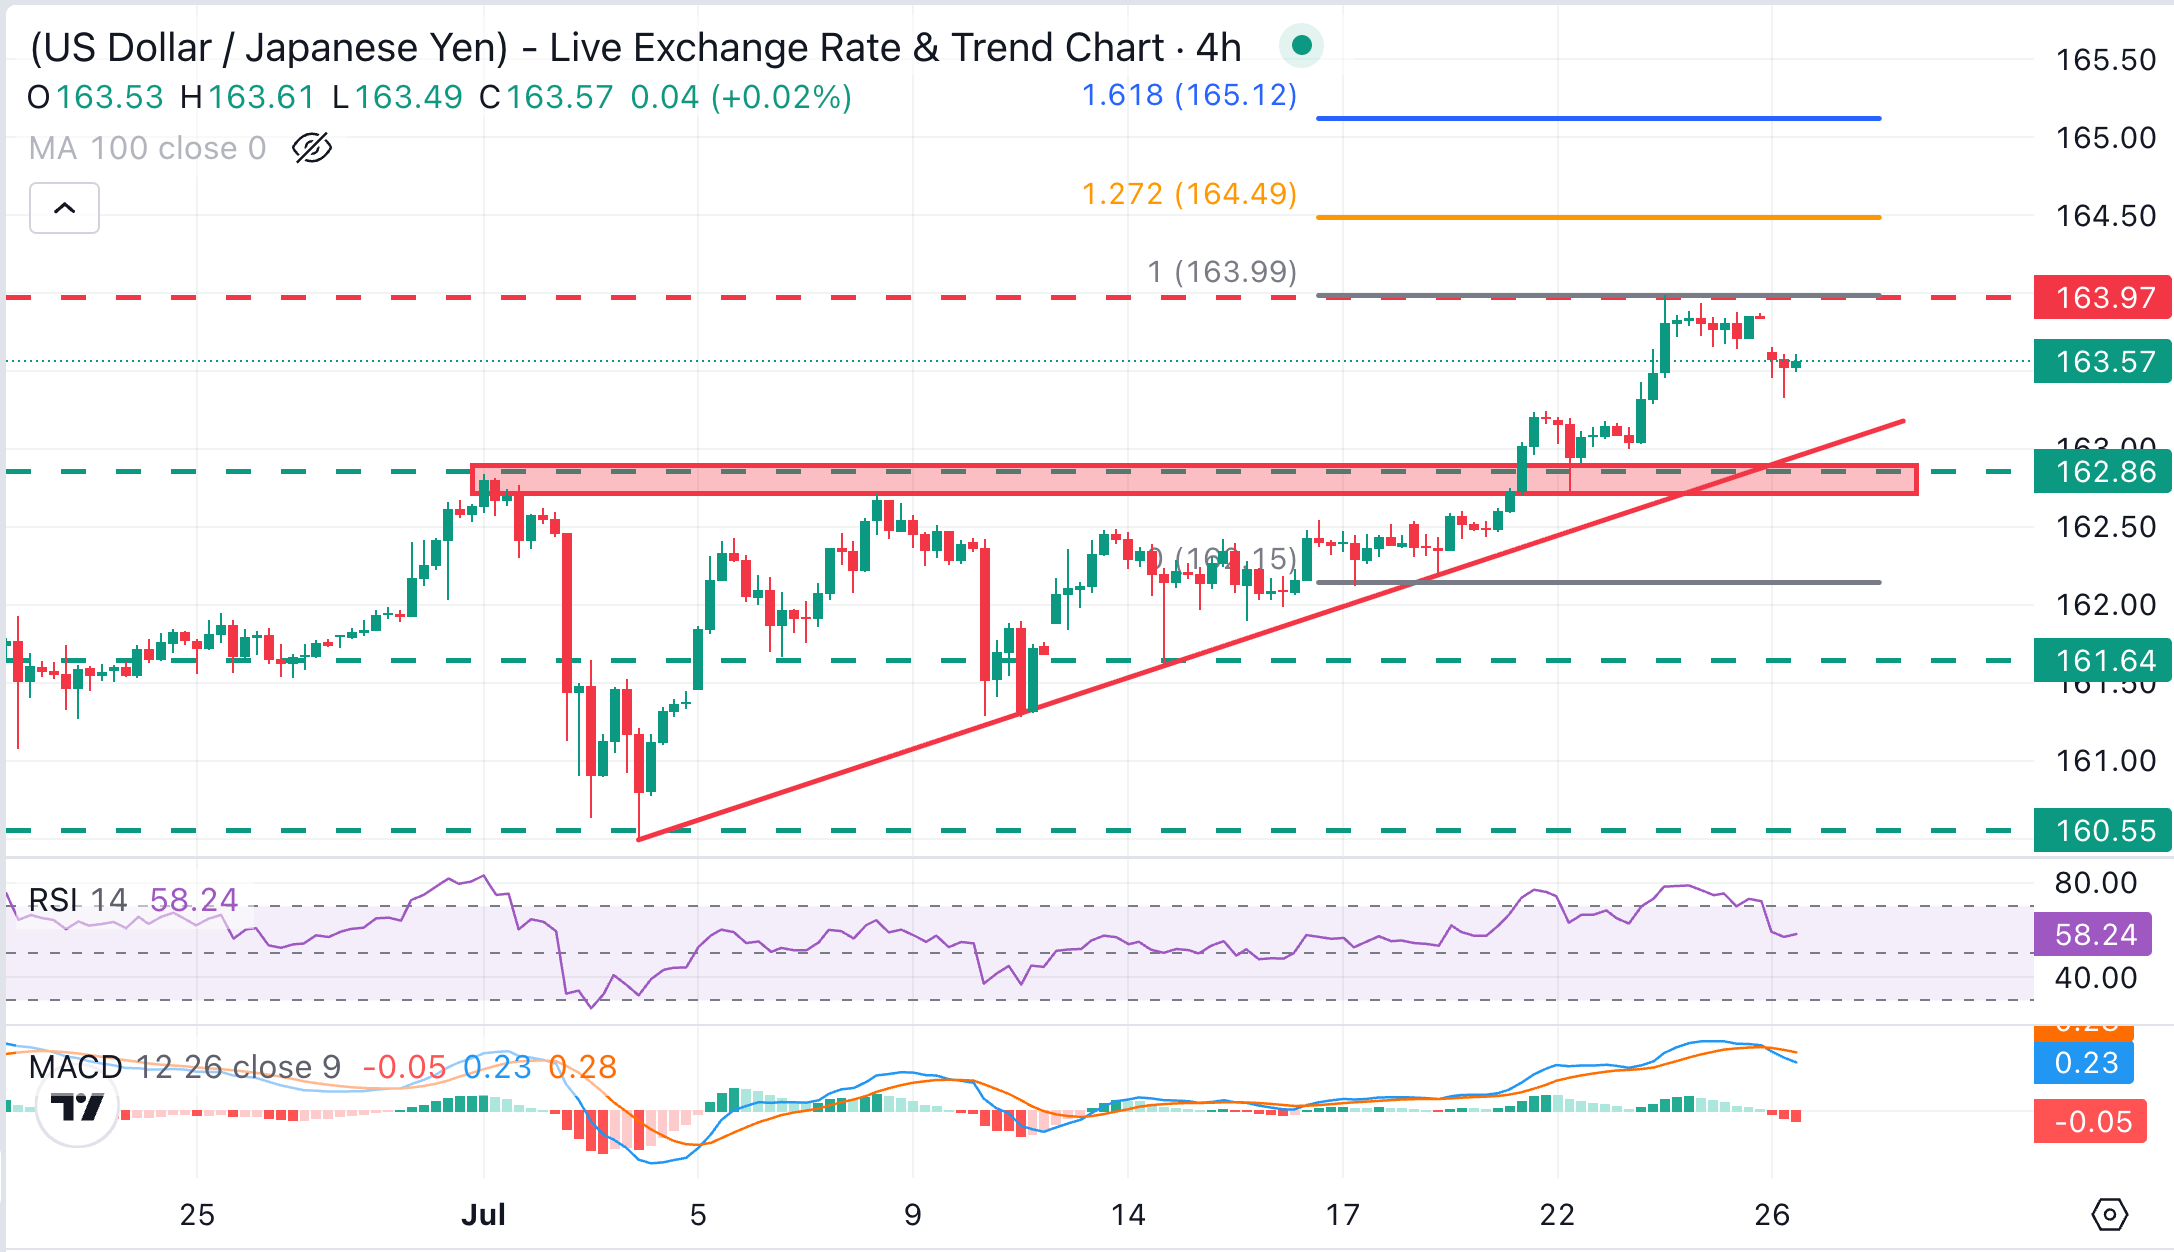
The USD/JPY pair trades at 163.67 at the time of writing, holding a constructive bullish stance, with dips contained well above a rising trend-line from early-July lows. Intra-day charts are hinting at a softer bullish impetus, with the 4-hour Relative Strength Index (14) trending back toward neutral territory, near 59, and the Moving Average Convergence Divergence (MACD) line crossing below the Signal line, which is a bearish sign.
Bears, however, remain contained above previous highs, in the mid-ranges of the 163.00s, with key support at the confluence of the mentioned trendline and July 6 and 8 highs in the 162.70-162.90 area. A confirmation below these levels puts sellers in control and adds pressure towards the July 17 and 20 lows at the 162.15 area.
On the topside, immediate resistance emerges at the horizontal barrier around last week's highs, near 165. Further up, the 127.2% Fibonacci retracement of the July 17-23 target, at the 163.50 area, emerges as a potential target.
(The technical analysis of this story was written with the help of an AI tool. Know more.)
US Dollar Price Today
The table below shows the percentage change of US Dollar (USD) against listed major currencies today. US Dollar was the strongest against the Canadian Dollar.
| USD | EUR | GBP | JPY | CAD | AUD | NZD | CHF | |
|---|---|---|---|---|---|---|---|---|
| USD | -0.25% | -0.07% | -0.18% | 0.07% | -0.31% | -0.16% | -0.41% | |
| EUR | 0.25% | 0.15% | 0.06% | 0.31% | -0.08% | 0.11% | -0.17% | |
| GBP | 0.07% | -0.15% | -0.09% | 0.17% | -0.23% | -0.07% | -0.32% | |
| JPY | 0.18% | -0.06% | 0.09% | 0.21% | -0.14% | 0.00% | -0.22% | |
| CAD | -0.07% | -0.31% | -0.17% | -0.21% | -0.36% | -0.21% | -0.46% | |
| AUD | 0.31% | 0.08% | 0.23% | 0.14% | 0.36% | 0.19% | -0.10% | |
| NZD | 0.16% | -0.11% | 0.07% | -0.01% | 0.21% | -0.19% | -0.30% | |
| CHF | 0.41% | 0.17% | 0.32% | 0.22% | 0.46% | 0.10% | 0.30% |
The heat map shows percentage changes of major currencies against each other. The base currency is picked from the left column, while the quote currency is picked from the top row. For example, if you pick the US Dollar from the left column and move along the horizontal line to the Japanese Yen, the percentage change displayed in the box will represent USD (base)/JPY (quote).
Recommended Articles


