


US Dollar Index touches 15-week high before fading into the close
- The US Dollar Index printed a bearish reversal candle as markets brace for Wednesday's CPI.
- February CPI due Wednesday with headline consensus at 0.3% MoM and 2.4% YoY; core CPI expected at 0.2% MoM and 2.5% YoY.
- Friday brings January core PCE at 0.4% MoM and 3% YoY, preliminary Q4 GDP at 1.4%, and March Michigan consumer sentiment forecast at 55.
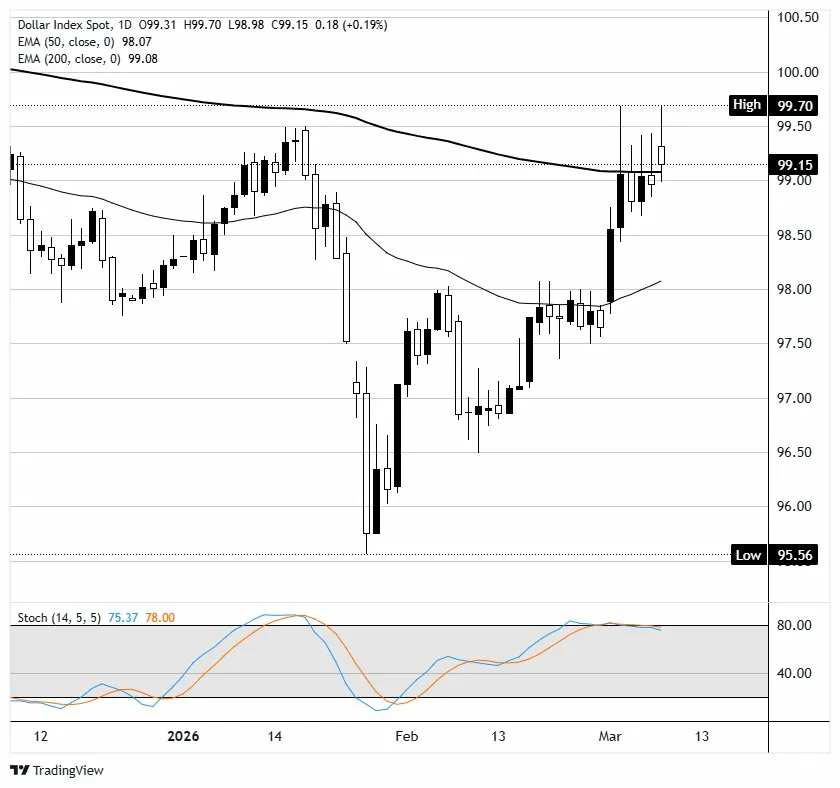
The US Dollar Index (DXY) slipped about 0.2% on Monday after touching a 15-week high near 99.70 in the early session. The index gapped higher at the open before sellers stepped in, pushing price back toward the 99.00 area by the close and leaving a long upper wick on the daily candle. The reversal came after a sharp rally from the late-January lows close to 95.56, with the index gaining roughly four points in six weeks as safe-haven demand and shifting rate expectations lifted the Greenback.
The US Dollar (USD) has been the primary beneficiary of the Strait of Hormuz crisis, with traders viewing the US as relatively insulated from the supply shock given its energy independence. Rate cut expectations have been scaled back sharply over the past week; markets now price only one 25 basis point cut from the Federal Reserve (Fed) this year, likely in September, compared with two cuts expected before the conflict began. The Fed is holding rates at 3.50% to 3.75%, and January Federal Open Market Committee (FOMC) minutes showed several officials discussed the possibility of hiking rates if inflation stays above target.
Wednesday's February Consumer Price Index (CPI) release from the Bureau of Labor Statistics (BLS) is the week's marquee event, with headline CPI expected at 0.3% MoM and 2.4% YoY. The energy price shock from the Hormuz closure began in the final days of February and is unlikely to be fully captured in this print, though any upside surprise would further cement the hawkish repricing. Friday's slate is equally dense: January core Personal Consumption Expenditures Price Index (PCE) is forecast at 0.4% MoM and 3% YoY; preliminary fourth-quarter Gross Domestic Product (GDP) is expected at 1.4% annualized; and the University of Michigan (UoM) March consumer sentiment index is forecast to drop to 55 from 56.6.
DXY daily chart
US Dollar FAQs
The US Dollar (USD) is the official currency of the United States of America, and the ‘de facto’ currency of a significant number of other countries where it is found in circulation alongside local notes. It is the most heavily traded currency in the world, accounting for over 88% of all global foreign exchange turnover, or an average of $6.6 trillion in transactions per day, according to data from 2022. Following the second world war, the USD took over from the British Pound as the world’s reserve currency. For most of its history, the US Dollar was backed by Gold, until the Bretton Woods Agreement in 1971 when the Gold Standard went away.
The most important single factor impacting on the value of the US Dollar is monetary policy, which is shaped by the Federal Reserve (Fed). The Fed has two mandates: to achieve price stability (control inflation) and foster full employment. Its primary tool to achieve these two goals is by adjusting interest rates. When prices are rising too quickly and inflation is above the Fed’s 2% target, the Fed will raise rates, which helps the USD value. When inflation falls below 2% or the Unemployment Rate is too high, the Fed may lower interest rates, which weighs on the Greenback.
In extreme situations, the Federal Reserve can also print more Dollars and enact quantitative easing (QE). QE is the process by which the Fed substantially increases the flow of credit in a stuck financial system. It is a non-standard policy measure used when credit has dried up because banks will not lend to each other (out of the fear of counterparty default). It is a last resort when simply lowering interest rates is unlikely to achieve the necessary result. It was the Fed’s weapon of choice to combat the credit crunch that occurred during the Great Financial Crisis in 2008. It involves the Fed printing more Dollars and using them to buy US government bonds predominantly from financial institutions. QE usually leads to a weaker US Dollar.
Quantitative tightening (QT) is the reverse process whereby the Federal Reserve stops buying bonds from financial institutions and does not reinvest the principal from the bonds it holds maturing in new purchases. It is usually positive for the US Dollar.
Recommended Articles


