




US Dollar Index rebounds from two-week lows as as tariff tensions resurface
- The US Dollar Index (DXY) bounces from two-week lows but stays on track for a weekly decline.
- Markets react to a mix of geopolitical developments and renewed trade tensions.
- DXY holds a bearish bias below key moving averages, with momentum remaining weak.
The US Dollar Index (DXY), which tracks the Greenback’s value against a basket of six major currencies, turns higher on Friday, recovering from earlier weakness, though it remains on track to close the week in negative territory.
It has been a volatile week for the US Dollar, with price action driven by suspected intervention by Japanese authorities, ongoing Middle East tensions, and renewed trade concerns. At the time of writing, the DXY is trading around 98.21, rebounding from a two-week low of 97.72 reached earlier in the day.
Trade tensions resurfaced after US President Donald Trump threatened to raise tariffs on European automobile imports to as high as 25%, offsetting earlier improvement in risk sentiment following reports that Iran submitted a new proposal through Pakistani mediators aimed at ending the war. While the proposal has raised hopes that talks could resume, tensions remain elevated amid differences over Iran’s nuclear program.
Against this backdrop, along with renewed trade threats, the Greenback is likely to remain supported in the near term, despite a still-weak technical outlook.
Technical Analysis:
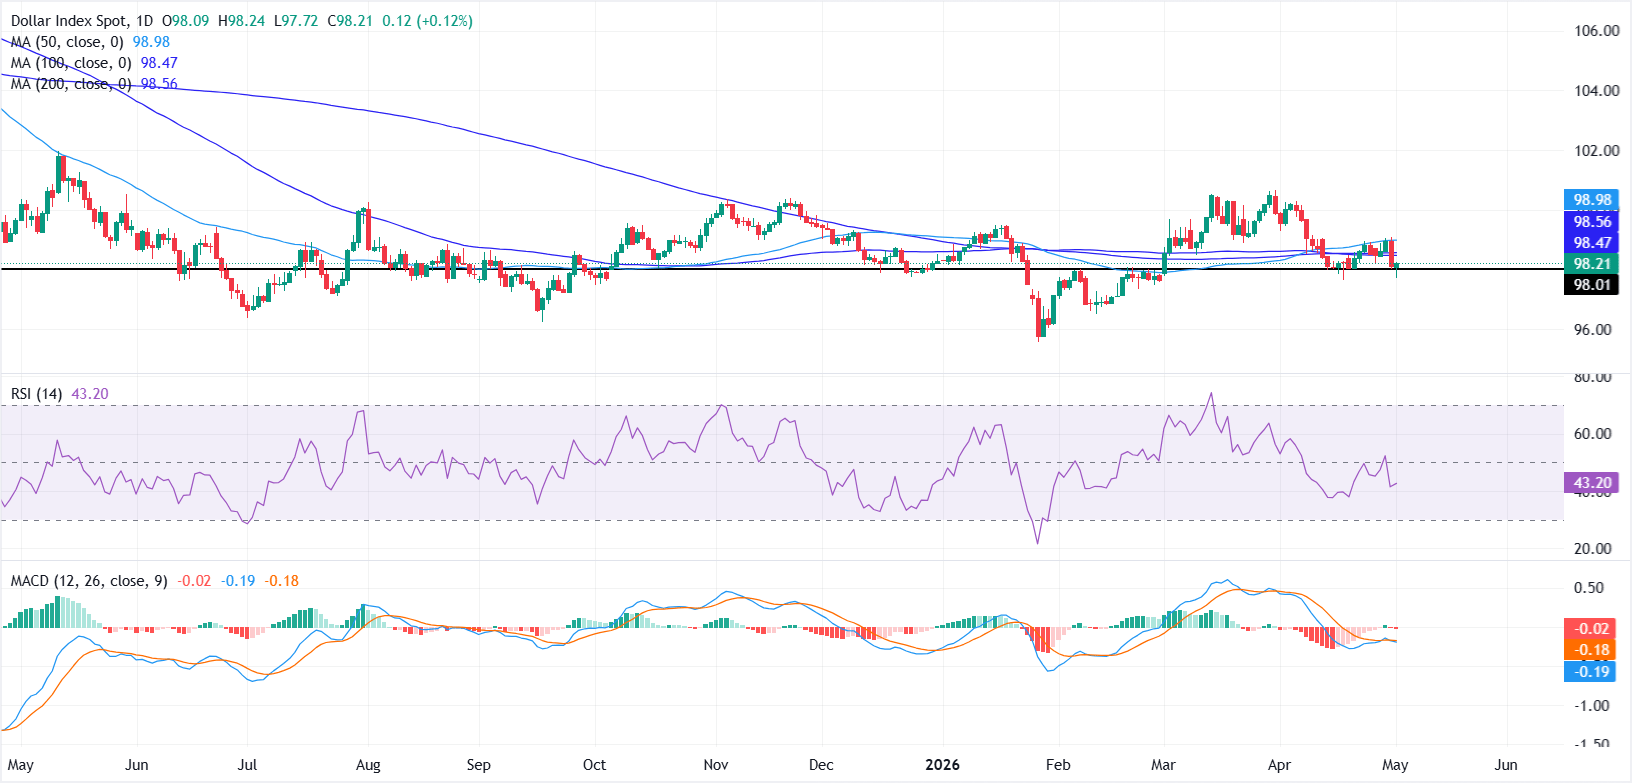
On the daily chart, the Dollar Index maintains a bearish near-term tone, trading below key moving averages. The 100-day Simple Moving Average (SMA) at 98.47, the 200-day SMA at 98.56 and the 50-day SMA near 98.98 form a layered resistance zone overhead, keeping upside attempts capped.
Momentum readings are soft rather than capitulatory, with the Relative Strength Index (RSI) hovering in the low-40s and Moving Average Convergence Divergence (MACD) still marginally negative, which suggests downside pressure persists but without a clear oversold signal.
On the downside, initial support is located at the horizontal level near 98.01, where buyers previously emerged to stabilize the decline. On the topside, a recovery would first need to reclaim the 100-day SMA at 98.47, with the 200-day SMA at 98.56 following closely as part of a congested resistance band, while the 50-day SMA near 98.98 represents a higher hurdle that would need to be cleared to ease the prevailing bearish bias.
(The technical analysis of this story was written with the help of an AI tool.)
US Dollar FAQs
The US Dollar (USD) is the official currency of the United States of America, and the ‘de facto’ currency of a significant number of other countries where it is found in circulation alongside local notes. It is the most heavily traded currency in the world, accounting for over 88% of all global foreign exchange turnover, or an average of $6.6 trillion in transactions per day, according to data from 2022. Following the second world war, the USD took over from the British Pound as the world’s reserve currency. For most of its history, the US Dollar was backed by Gold, until the Bretton Woods Agreement in 1971 when the Gold Standard went away.
The most important single factor impacting on the value of the US Dollar is monetary policy, which is shaped by the Federal Reserve (Fed). The Fed has two mandates: to achieve price stability (control inflation) and foster full employment. Its primary tool to achieve these two goals is by adjusting interest rates. When prices are rising too quickly and inflation is above the Fed’s 2% target, the Fed will raise rates, which helps the USD value. When inflation falls below 2% or the Unemployment Rate is too high, the Fed may lower interest rates, which weighs on the Greenback.
In extreme situations, the Federal Reserve can also print more Dollars and enact quantitative easing (QE). QE is the process by which the Fed substantially increases the flow of credit in a stuck financial system. It is a non-standard policy measure used when credit has dried up because banks will not lend to each other (out of the fear of counterparty default). It is a last resort when simply lowering interest rates is unlikely to achieve the necessary result. It was the Fed’s weapon of choice to combat the credit crunch that occurred during the Great Financial Crisis in 2008. It involves the Fed printing more Dollars and using them to buy US government bonds predominantly from financial institutions. QE usually leads to a weaker US Dollar.
Quantitative tightening (QT) is the reverse process whereby the Federal Reserve stops buying bonds from financial institutions and does not reinvest the principal from the bonds it holds maturing in new purchases. It is usually positive for the US Dollar.
Recommended Articles


