



Pi Network price forecast: PI extends losses as social interest declines

Source Fxstreet
  • Pi Network edges lower on Tuesday, testing the bearish breakout of the $0.0774 support level.
  • PI token’s social dominance score drops to a six-month low, suggesting reduced retail interest.
  • The technical outlook for PI suggests a downside bias, with sellers targeting the all-time low of $0.0704.

Pi Network (PI) is down nearly 2% on Tuesday, extending the previous day’s losses and risking an extended decline toward its record low of $0.0704. PI token’s social dominance score is down to a six-month low, suggesting reduced social interest. The technical outlook for the PI token is bearish as the correction phase gains momentum.

Social chatter softens around PI

Pi Network’s social positioning is declining as it loses share of voice in crypto-related online discussions. Santiment data shows the PI token's social dominance dropped to 0.03% on Monday, marking a six-month low, with a social volume of 2. This implies reduced market chatter about PI, a crucial bullish catalyst tied to speculative demand. 
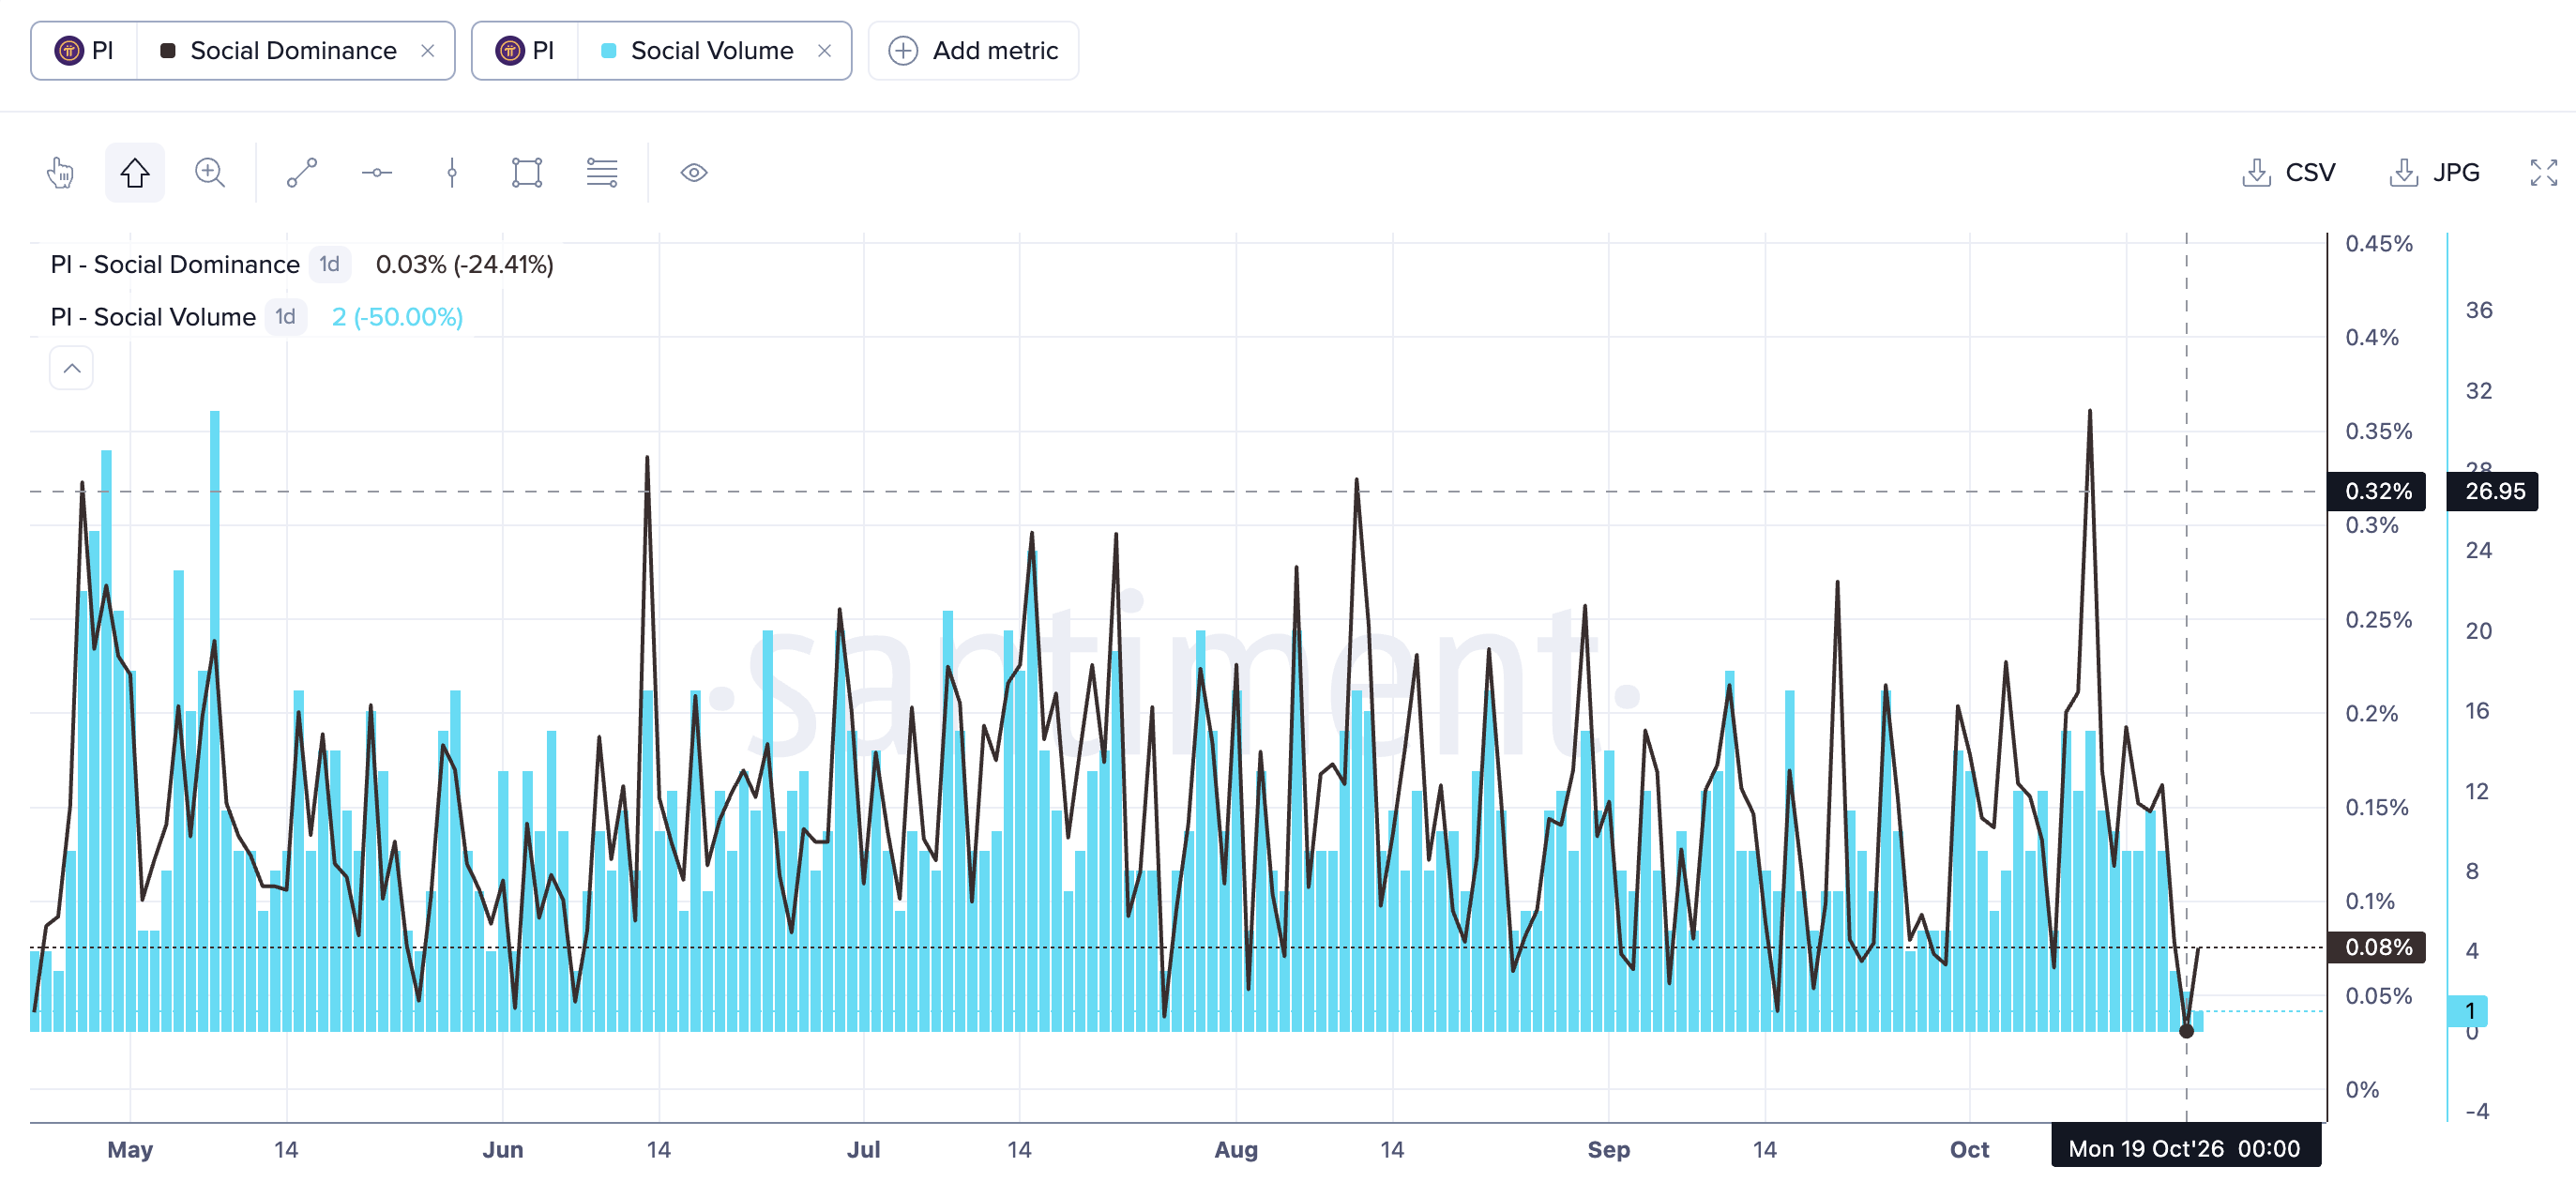
PI social interest data. Source: Santiment

Technical outlook: How low will the Pi Network price go?

Pi Network trades around $0.0772 on Tuesday, extending a long-term bearish trend capped by an overhead resistance trendline, connecting the June 20 and August 22 highs, near $0.0838. PI token's declining trend is also beneath the 50-period Exponential Moving Average (EMA) at $0.0862 and the 200-period EMA at $0.1221.

Momentum reinforces this capped tone, with the Relative Strength Index (RSI) hovering around 35 and Moving Average Convergence Divergence (MACD) in negative territory with a slightly negative histogram, hinting that sellers still control the near-term direction.

A confirmed breakout below the October 8 low at $0.0774 could extend the decline toward the $0.0704 swing low. Any deeper pullbacks will plunge the PI token into a downside price-discovery mode.

Chart Analysis PI/USD (baha Crypto)
PI/USD daily price chart.

On the topside, initial resistance emerges at the downtrend break level around $0.0838, followed closely by a dense cluster formed by the 50-period EMA at $0.0862 and the 23.6% Fibonacci retracement, measured from $0.1394 to $0.0704, at $0.0867. Above this area, the 50% level at $0.1049 and the 200-day EMA at $0.1221 outline the subsequent barrier.

(The technical analysis of this story was written with the help of an AI tool. Know more.)

Disclaimer: For information purposes only. Past performance is not indicative of future results.
placeholder
Will Brent Jump 28% Again? US and Israel Draft Post-Midterm Iran Strike PlansThe US and Israel have drafted plans for Iran strikes after the Nov. 3 midterms, The New York Times reports. Energy sites appear on the reported target list, with Brent crude already near $109 a barre
Author  Beincrypto
2 hours ago
The US and Israel have drafted plans for Iran strikes after the Nov. 3 midterms, The New York Times reports. Energy sites appear on the reported target list, with Brent crude already near $109 a barre
placeholder
Netflix Stock Hits 26-Month Low, But Revenue Tells a Different StoryNetflix stock fell to $64.10 on Wednesday, its lowest level since August 2024. The streamer beat profit estimates, yet a weaker fourth-quarter outlook sent investors heading for the exit.The slide lea
Author  Beincrypto
2 hours ago
Netflix stock fell to $64.10 on Wednesday, its lowest level since August 2024. The streamer beat profit estimates, yet a weaker fourth-quarter outlook sent investors heading for the exit.The slide lea
placeholder
Elon Musk’s Starlink Is Winning on Wall Street as Stocks RallyWould you switch airlines for better Wi-Fi? United Airlines says passengers are already doing it. The airline says Starlink is drawing passengers away from competitors, while SpaceX is earning billion
Author  Beincrypto
2 hours ago
Would you switch airlines for better Wi-Fi? United Airlines says passengers are already doing it. The airline says Starlink is drawing passengers away from competitors, while SpaceX is earning billion
placeholder
Is Bitcoin on the Verge of a Deeper Correction? The S&P 500 May Hold the AnswerBitcoin is consolidating near $82,000 to $83,000 after retreating from recent highs above $87,000. A new CryptoQuant analysis warns that the S&P 500 is showing similar weakness.Analysts are split on w
Author  Beincrypto
2 hours ago
Bitcoin is consolidating near $82,000 to $83,000 after retreating from recent highs above $87,000. A new CryptoQuant analysis warns that the S&P 500 is showing similar weakness.Analysts are split on w
placeholder
Market News Today Australia: Nasdaq Rallies, Gold Rebounds as Meta Earnings BeatNasdaq rises 1.05%, Meta reports strong earnings and gold rebounds. Explore today's Australian market outlook for oil, AUD/USD and the ASX 200.
Author  Mitrade Team
1 hour ago
Nasdaq rises 1.05%, Meta reports strong earnings and gold rebounds. Explore today's Australian market outlook for oil, AUD/USD and the ASX 200.
goTop
quote