




Pepe Price Forecast: Whale distribution, mixed derivatives cap recovery
- Pepe remains under pressure on Thursday after being rejected at the 200-day EMA around $0.0000036.
- Santiment data shows large wallets are reducing their PEPE holdings, while smaller wallets continue to accumulate the token.
- Mixed sentiment in the derivatives market and weakening momentum indicators cap PEPE’s recovery.
Pepe (PEPE) remains under pressure, trading around $0.00000348 at the time of writing on Thursday after being rejected at a key resistance zone. Santiment data shows whale distribution, potentially fueling near-term selling pressure and capping PEPE. Meanwhile, mixed derivatives alongside weakening momentum indicators risk a deeper correction for the meme coin.
Whales offloading meme coin
Santiment’s Supply Distribution data shows certain large-wallet holders (whales) are offloading the PEPE meme coin after massive gains during mid-August.
The metric indicates that whales holding between 10 million and 100 million (blue line) have offloaded 80 billion PEPE tokens since August 25. During the same period, mid- and smaller wallets of 1 million and 10 million (yellow line) and 100,000 and 1 million (red line) have accumulated 5.06 billion. This divergence suggests that larger holders are taking profits while smaller investors continue to accumulate, potentially fueling near-term selling pressure and capping the meme coin.
 [11-1789026547911.22.23, 10 Sep, 2026].png)
Mixed derivatives metrics cap PEPE
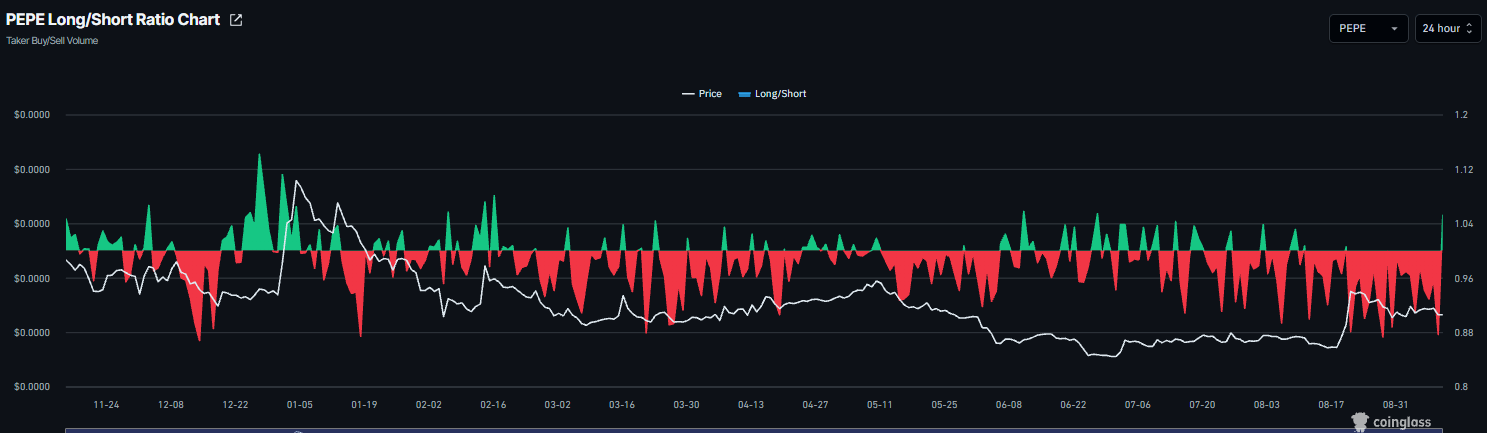
Pepe derivatives metrics show a mixed outlook. CoinGlass’ long-to-short ratio for PEPE reads 1.05 on Thursday, nearing the highest level over a month. This ratio above one reflects bullish sentiment, as more traders are betting on the meme coin to rally.
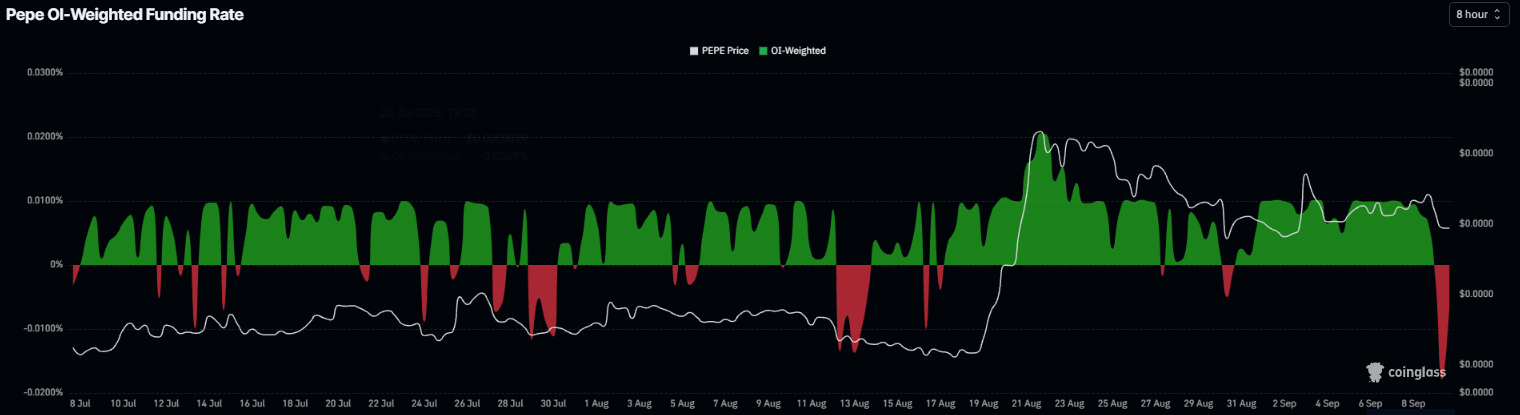
However, the funding rates point to a cautious outlook. CoinGlass’ OI-weighted funding rate data for Pepe flipped negative on Wednesday, reading -0.0067% on Thursday. This negative rate indicates shorts are paying longs and signals a bearish sentiment.
Pepe Price Forecast: Faces rejection from the 200-day EMA
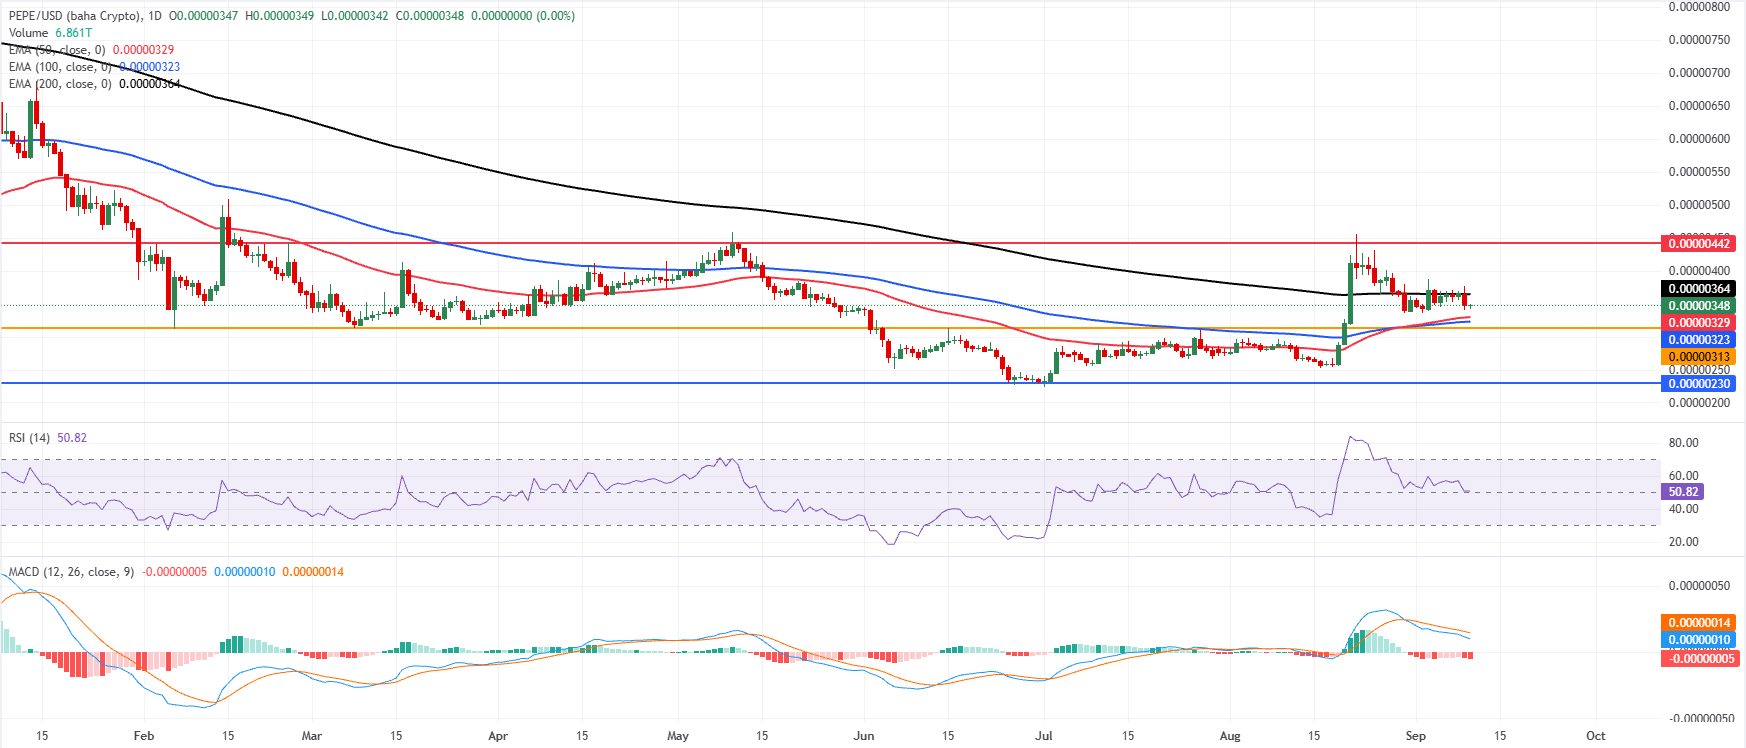
Pepe price trades at 0.00000348 on Thursday after being rejected by the 200-day Exponential Moving Average (EMA) at $0.00000364 the previous day.
Momentum indicators also show fading bullish momentum. The Relative Strength Index (RSI) is pointing down toward the neutral level of 50. In addition, the Moving Average Convergence Divergence (MACD) also showed a bearish crossover last week, which remains intact, supporting a negative outlook.
On the downside, the 50-day and 100-day EMA act as a key support around $0.00000320, followed by the horizontal support around $0.00000313. A close below this zone would suggest a deeper correction toward the next daily support around $0.00000230.
On the topside, the 200-day EMA at $0.00000364 holds as resistance; a close above this suggests a rally toward the next daily resistance near $0.00000442.
(The technical analysis of this story was written with the help of an AI tool. Know more.)
Recommended Articles


