




Crypto Market Overview: Bitcoin eyes 50-day EMA breakout – Ondo, Ether.fi beat the market
- Bitcoin holds above $64,000 on Thursday, testing the breakout of its 50-day EMA around $65,136.
- Ondo rallies over 16% in 24 hours on the launch of its first tokenized stock representations backed by DTC-tokenized entitlements.
- Ether.fi tests a crucial resistance trendline breakout near $0.4400 on Thursday, following an 11% rise the previous day.
The broader cryptocurrency market shows early signs of recovery, with Bitcoin (BTC) testing a breakout above its 50-day Exponential Moving Average (EMA) around $65,136. Improving risk appetite has investors turning toward DeFi tokens such as Ondo (ONDO) and Ether.fi (ETHFI) that emerge as best performers over the last 24 hours.
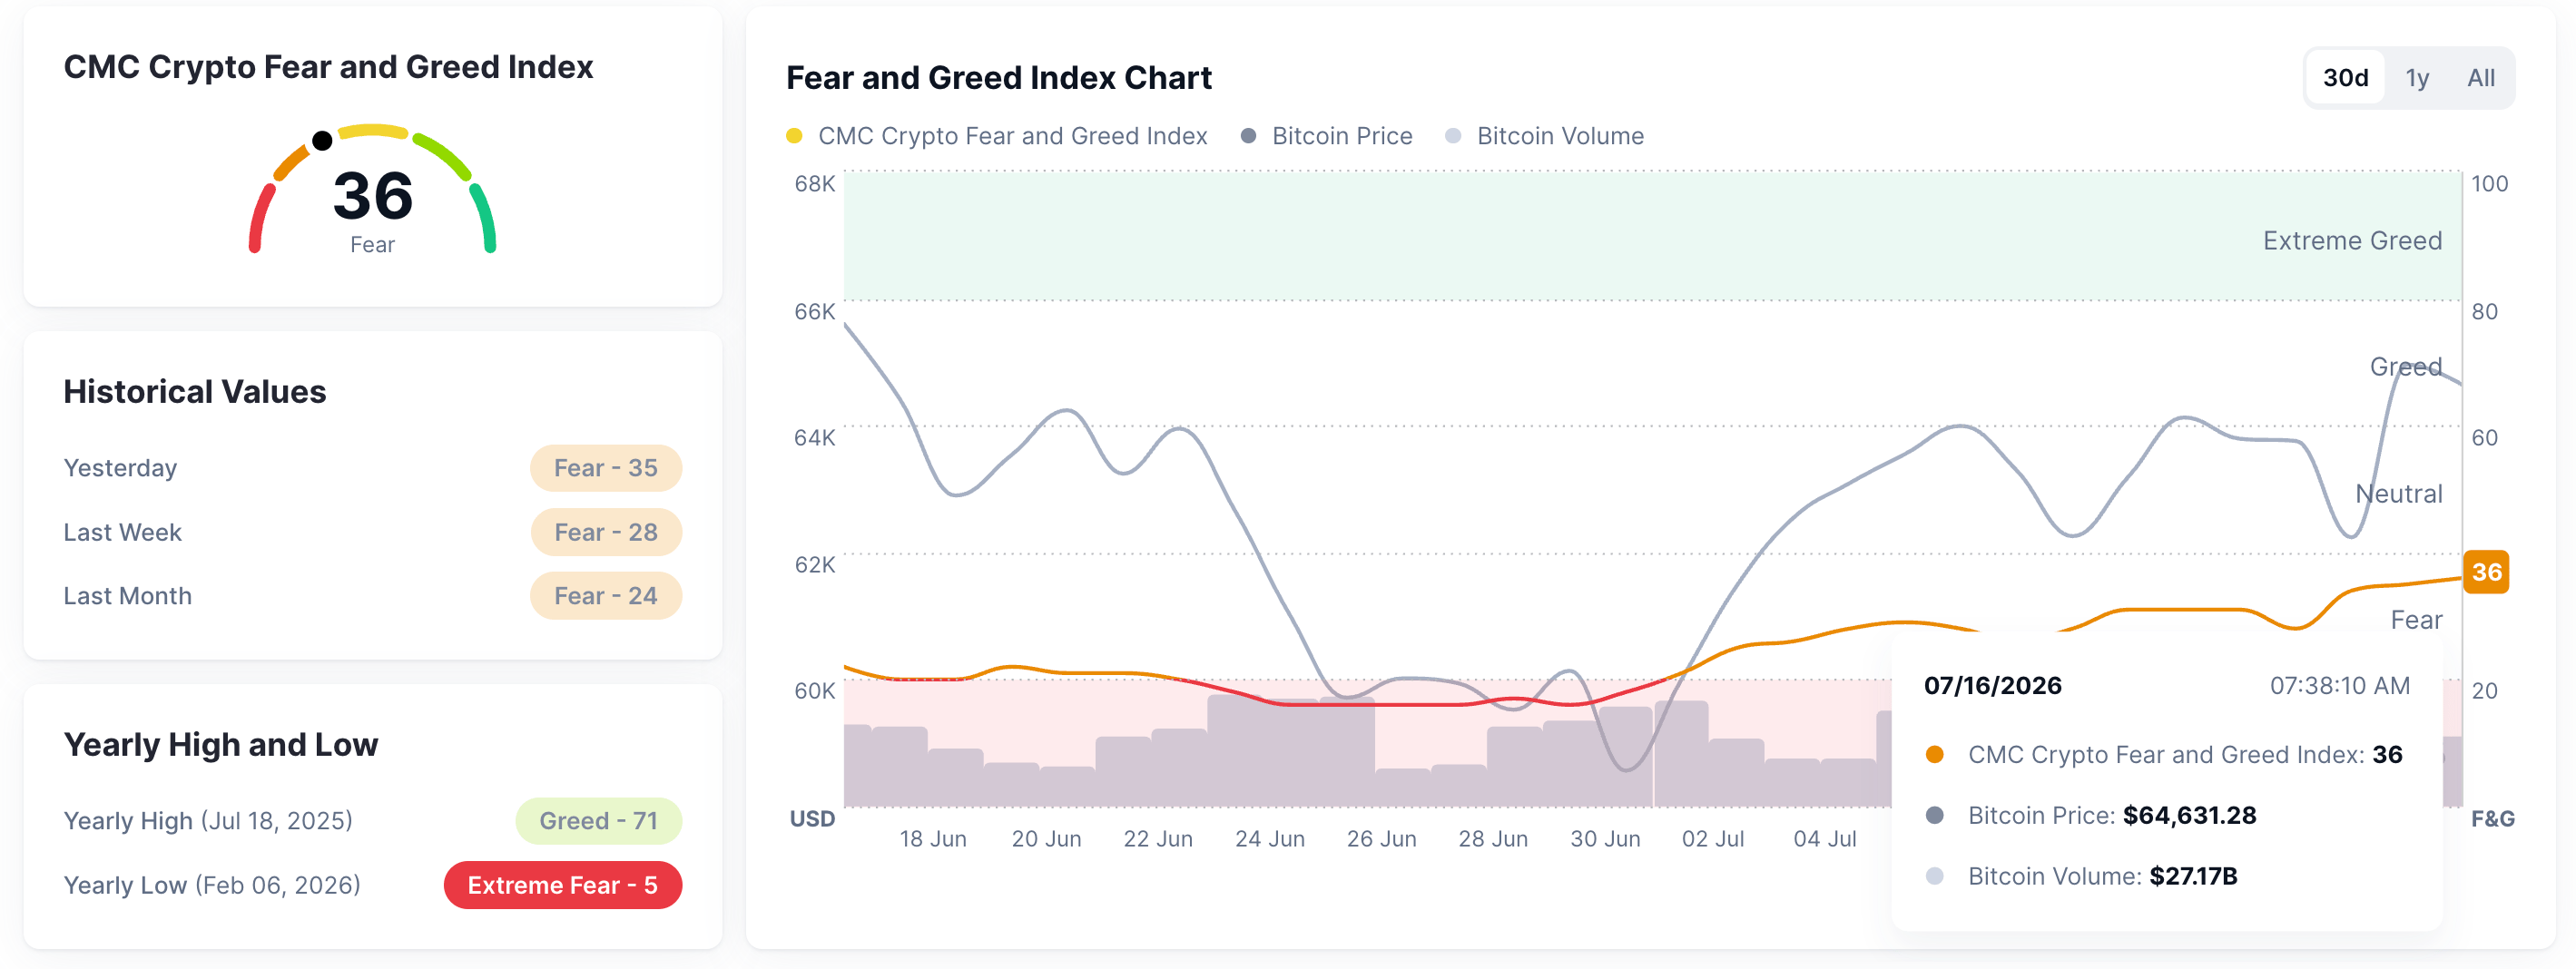
CoinMarketCap’s Fear and Greed Index at 36 on Thursday shows a largely recovering market sentiment, up from 28 last week.
Could Bitcoin reclaim $65,000 amid easing geopolitical and inflation risk?
Bitcoin’s near-term recovery after testing sub-$60,000 levels earlier this month aligns with the easing geopolitical tensions between the US and Iran. In addition, the bullish US CPI data for June has reduced the odds of interest rate hikes, prompting risk-on sentiment among investors.
Bitcoin inches closer to $65,000 on Thursday, but the EMA around $65,136 keeps the broader technical tone fragile despite a modest recovery. Momentum indicators are more constructive, as the Relative Strength Index (RSI) is at 55, hovering just above the neutral midline, while the Moving Average Convergence Divergence (MACD) maintains an uptrend with its signal line, which together suggests that downside pressure is easing but not yet strong enough to reclaim key overhead levels.
On the topside, immediate resistance is defined by the 50-day EMA at $65,136, and a sustained break above this barrier would open the way toward the $70,000 mark, followed by the 200-day EMA around $74,484.
On the downside, initial support aligns with the horizontal level at 60,000, where a break lower would expose further weakness.
Ondo rallies on DTC-compliant tokenized stock representations
Ondo reclaimed its 50-day EMA at $0.3367 with a nearly 16% rebound on Wednesday. The pair inches closer to the 200-day EMA at $0.3769, which remains an overhead barrier, keeping the near-term bias neutral to mildly constructive.
Momentum tones are supportive, with the RSI at 63 and hovering in bullish territory, while the MACD holds above its signal line, suggesting buyers still retain the upper hand despite nearby overhead supply.
A breakout above the 200-day EMA at $0.3769 could extend its rally to the $0.4524 selling zone, which has capped multiple recovery attempts over the past seven months.
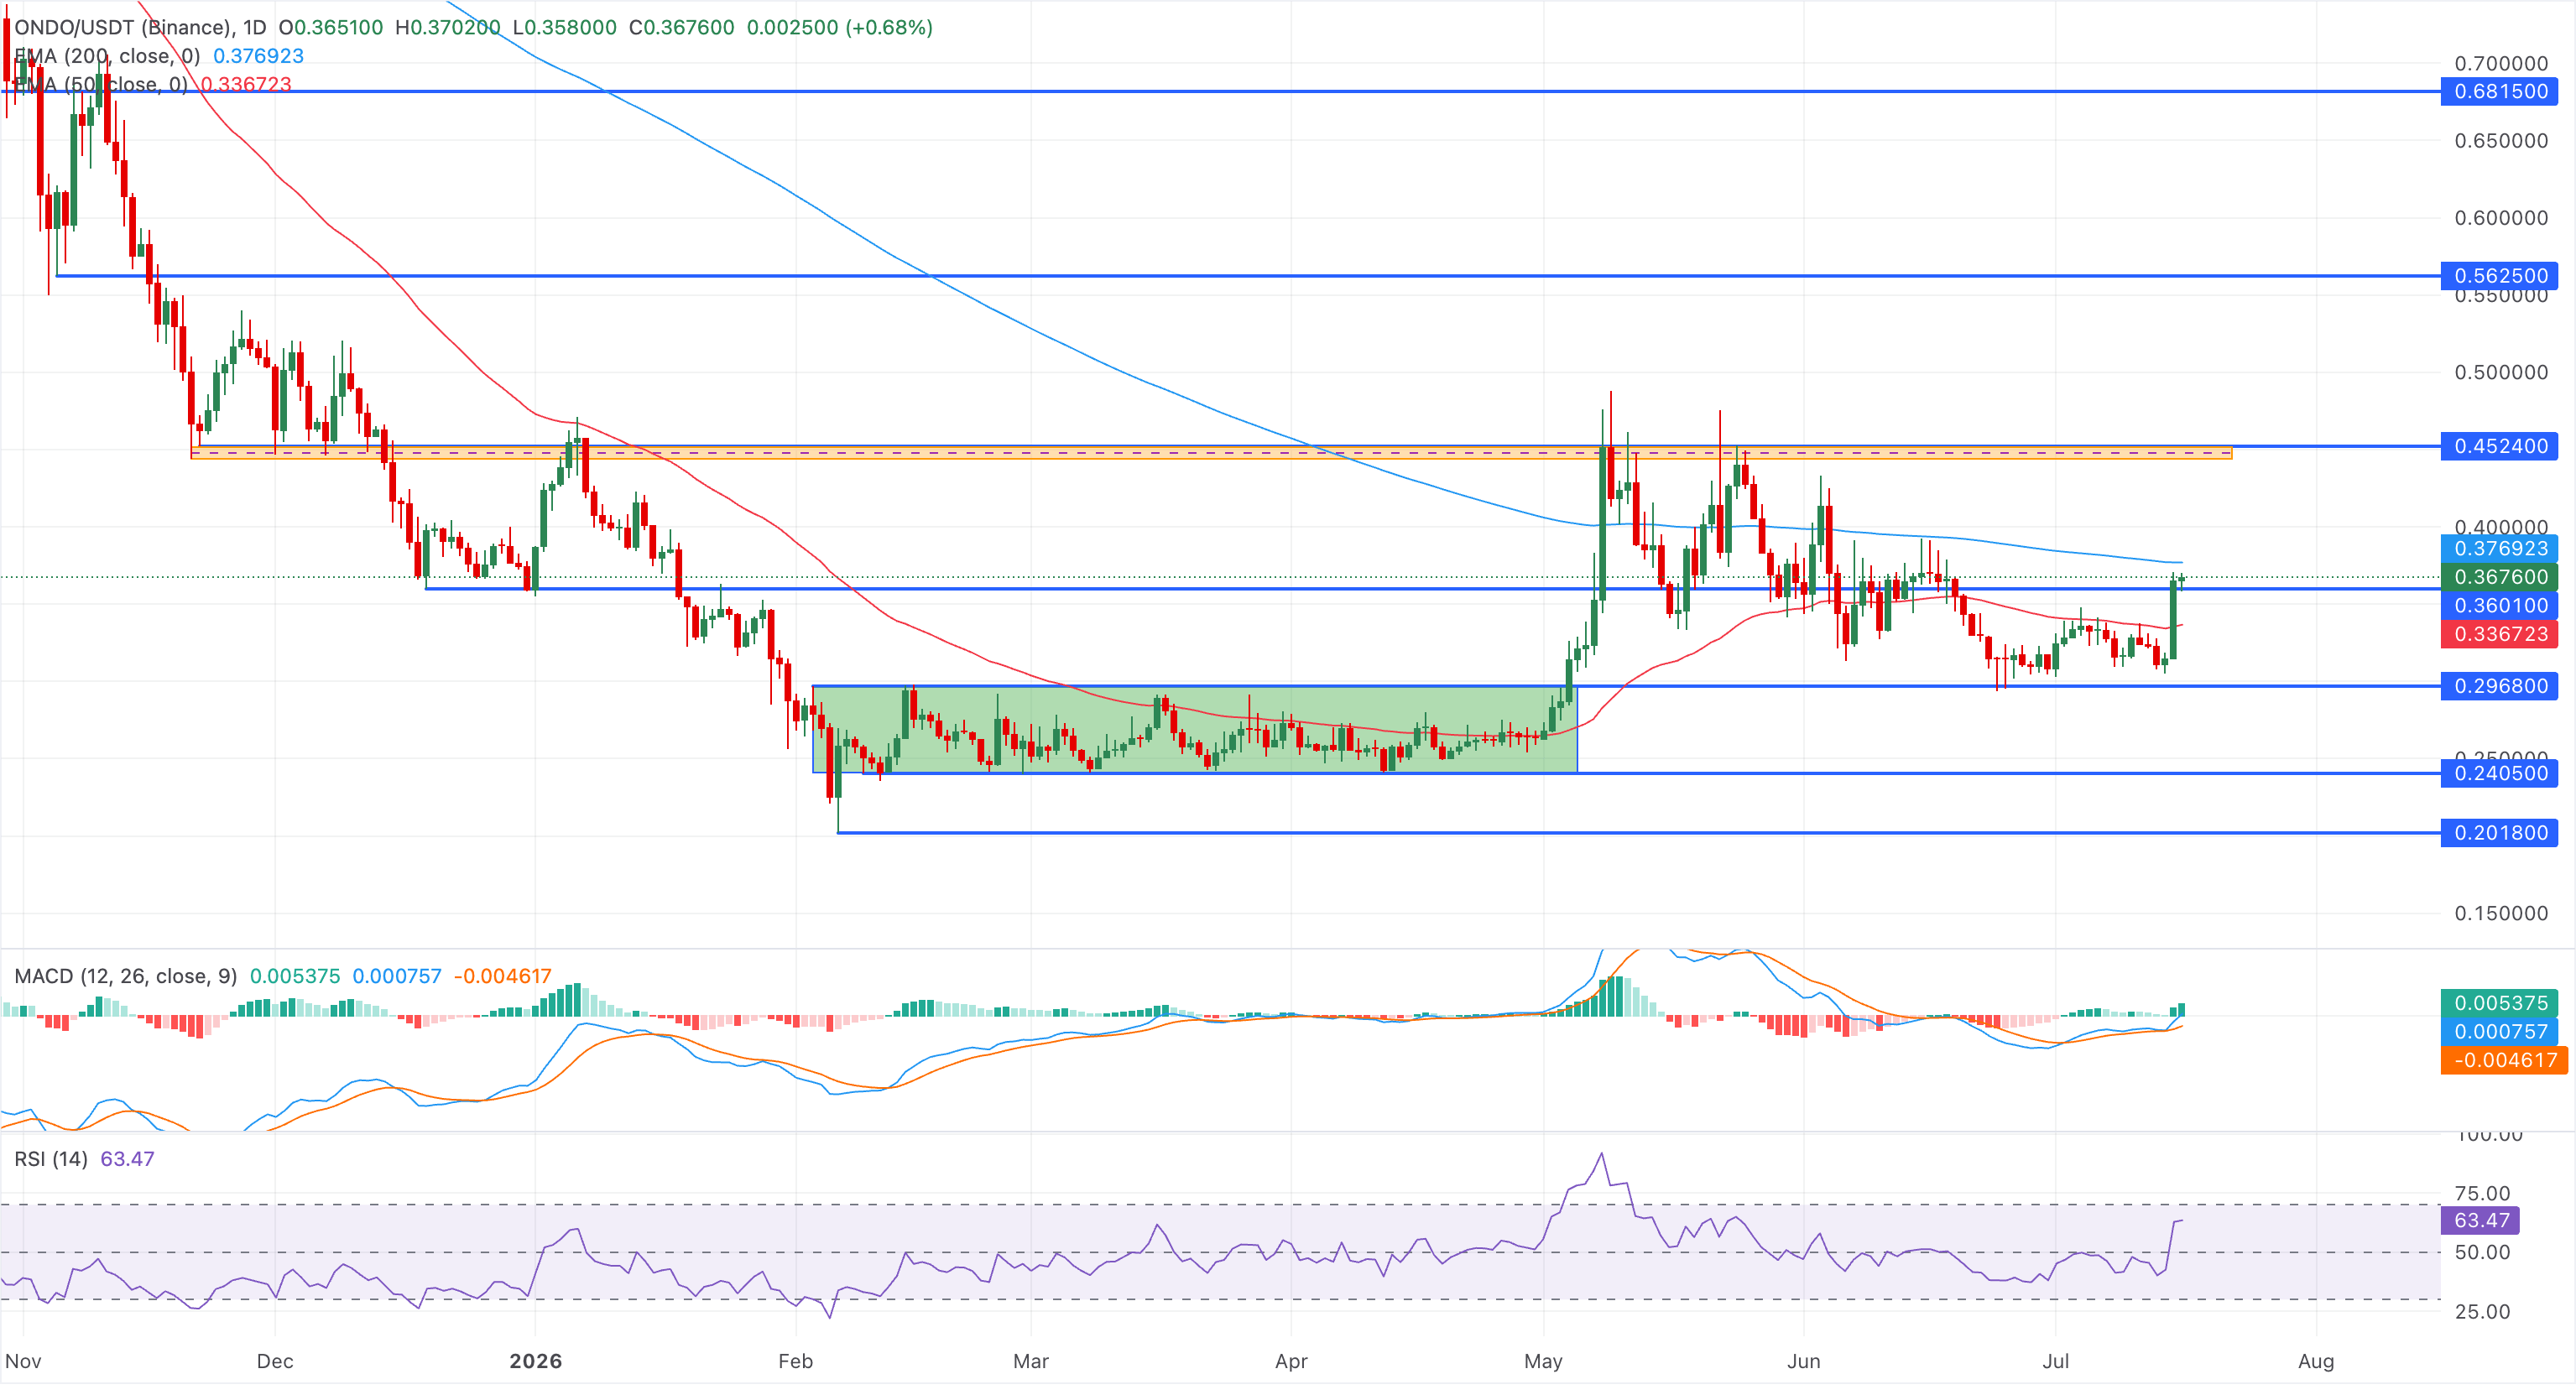
On the downside, immediate support is at the 50-day EMA near $0.3367, where a break would likely trigger a deeper pullback and signal that the latest advance is losing traction.
Ether.fi eyes a breakout rally toward the 200-day EMA
Ether.Fi rises above its 50-day EMA at $0.3813 with an 11% rise on Wednesday. At the time of writing, ETHFI tests breaking above an overhead resistance trendline near $0.4400 on Thursday, potentially reinstating a bullish recovery.
However, the pair remains capped below its 200-day EMA at $0.5077, which could serve as key resistance following the trendline breakout.
The RSI at around 62 suggests firm but not yet overbought upside momentum, and the MACD remains above its signal line in the positive territory, hinting that buying pressure is still driving the recovery.
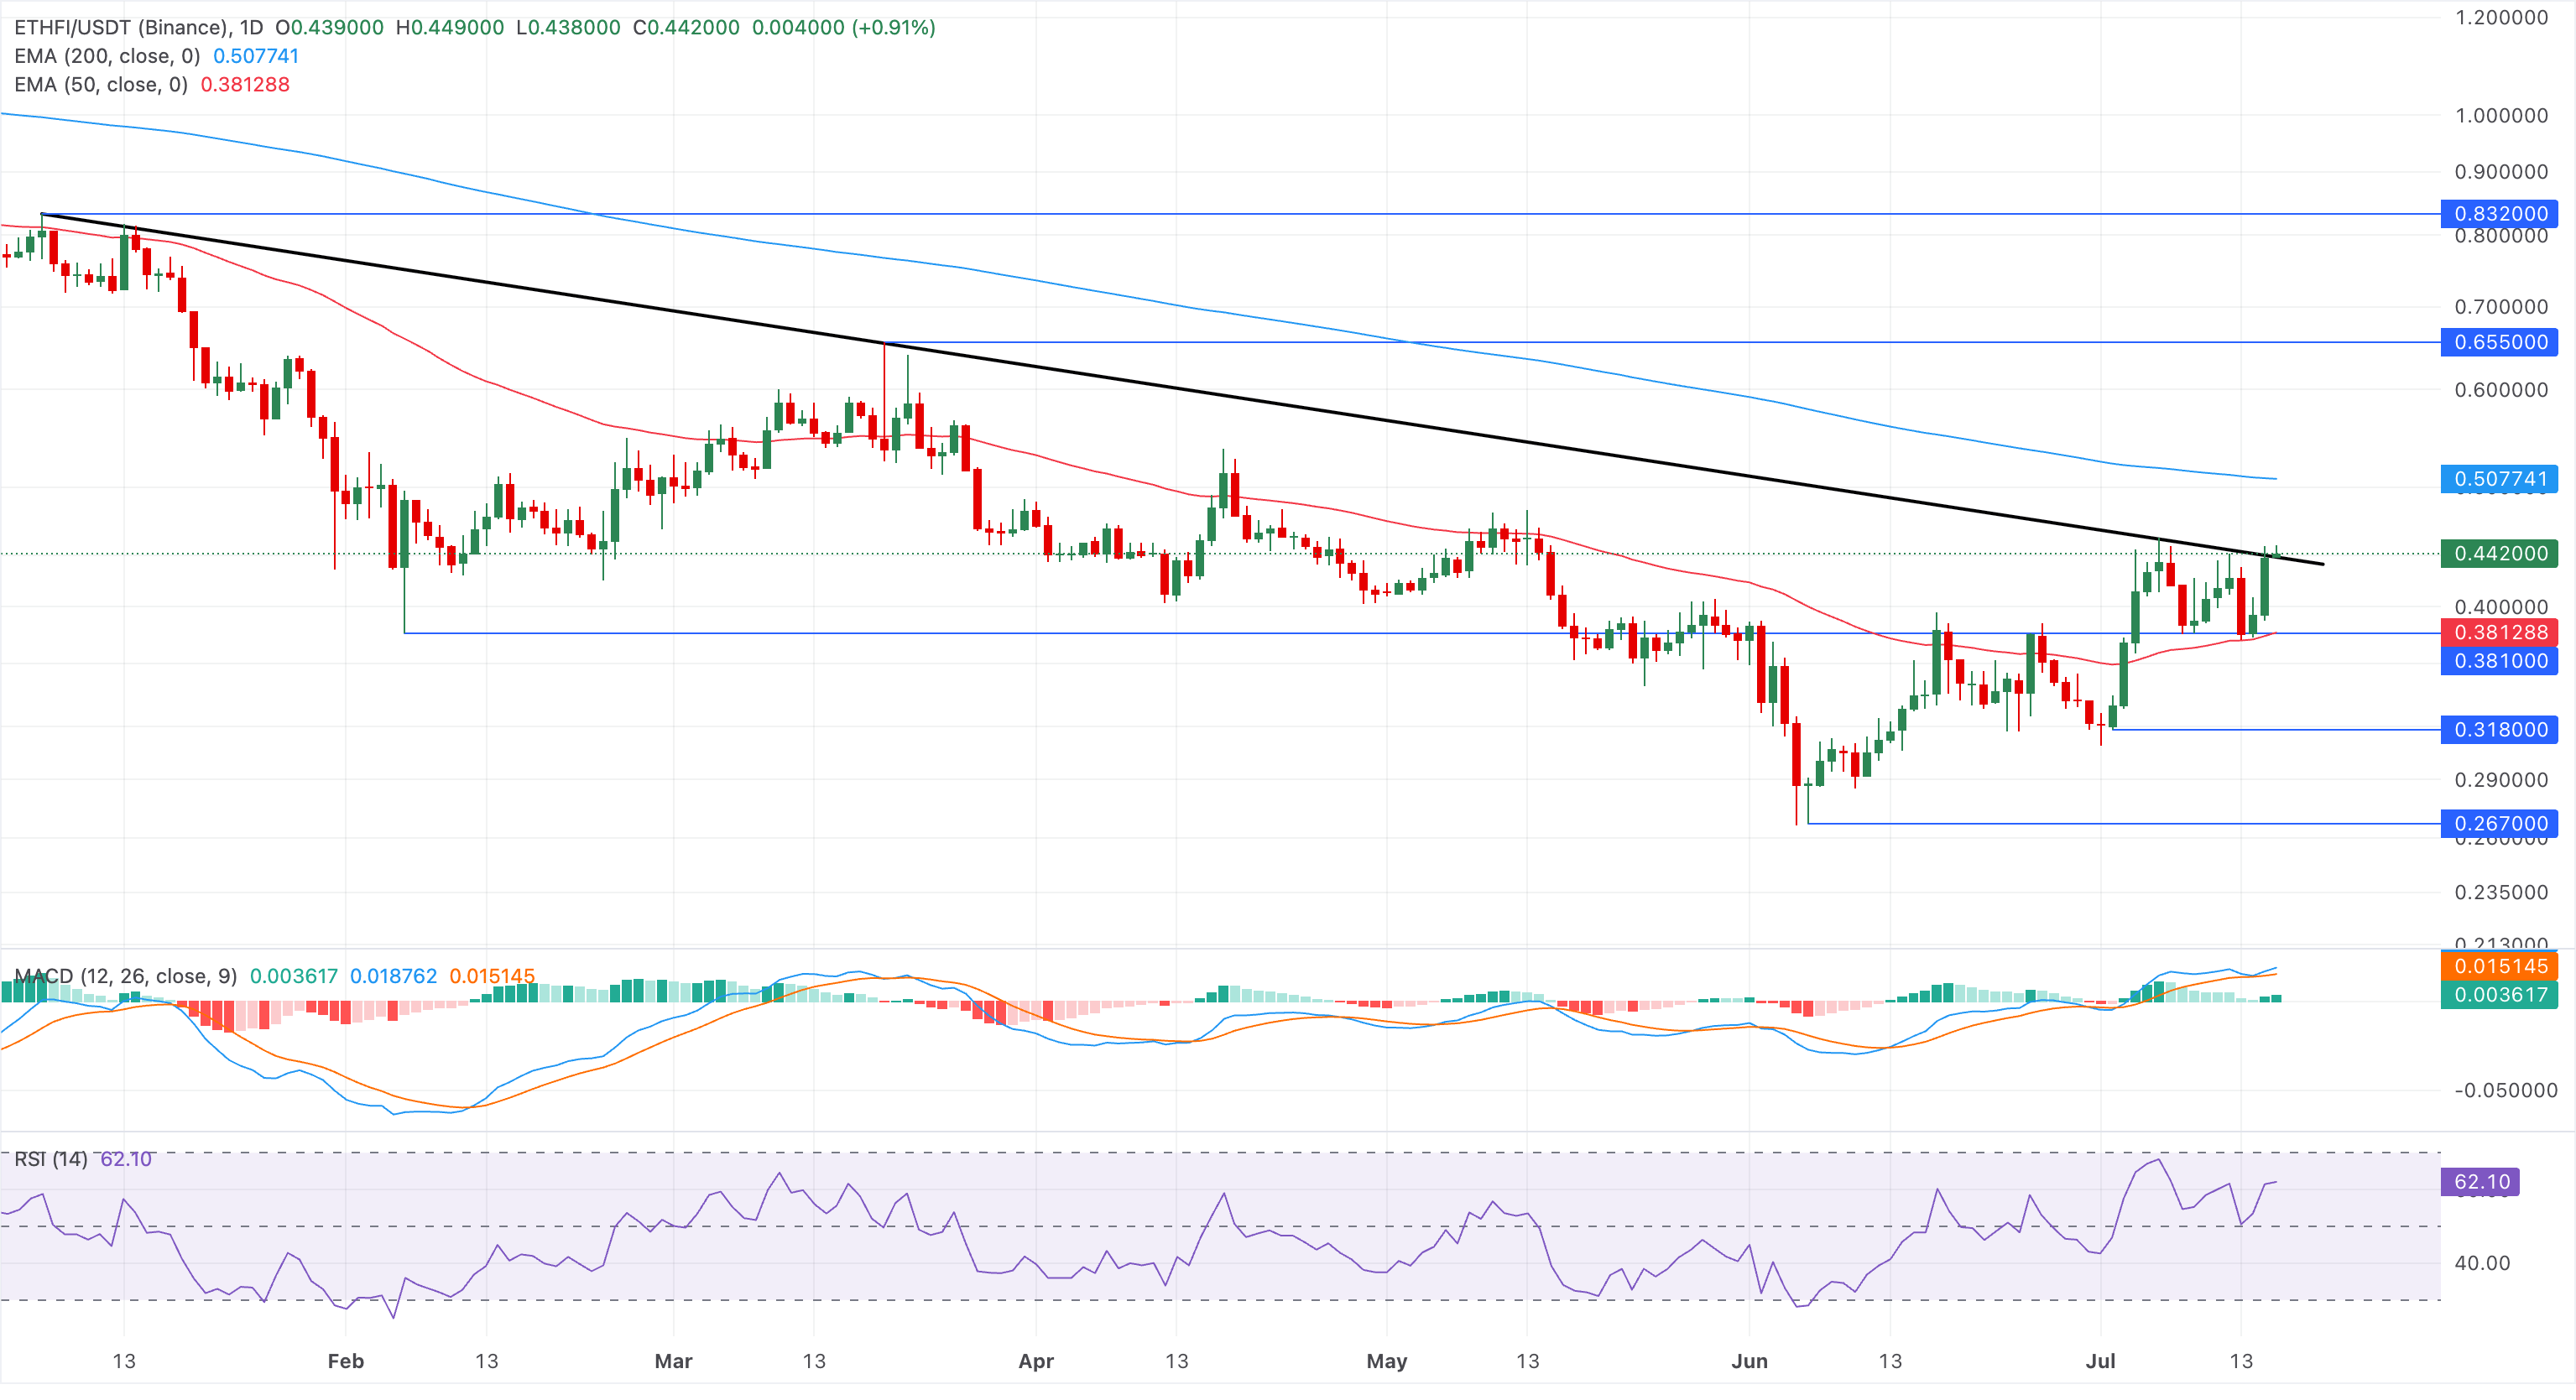
Looking down, initial support is seen around the reclaimed 50-day EMA at $0.3813 as a more significant bullish defense area.
(The technical analysis of this story was written with the help of an AI tool. Know more.)
Recommended Articles


