


Crypto Today: Bitcoin, Ethereum, XRP extend correction as risk-off sentiment weighs
- Bitcoin pulls back below $80,000 as sentiment returns to fear, reflected by ETF outflows.
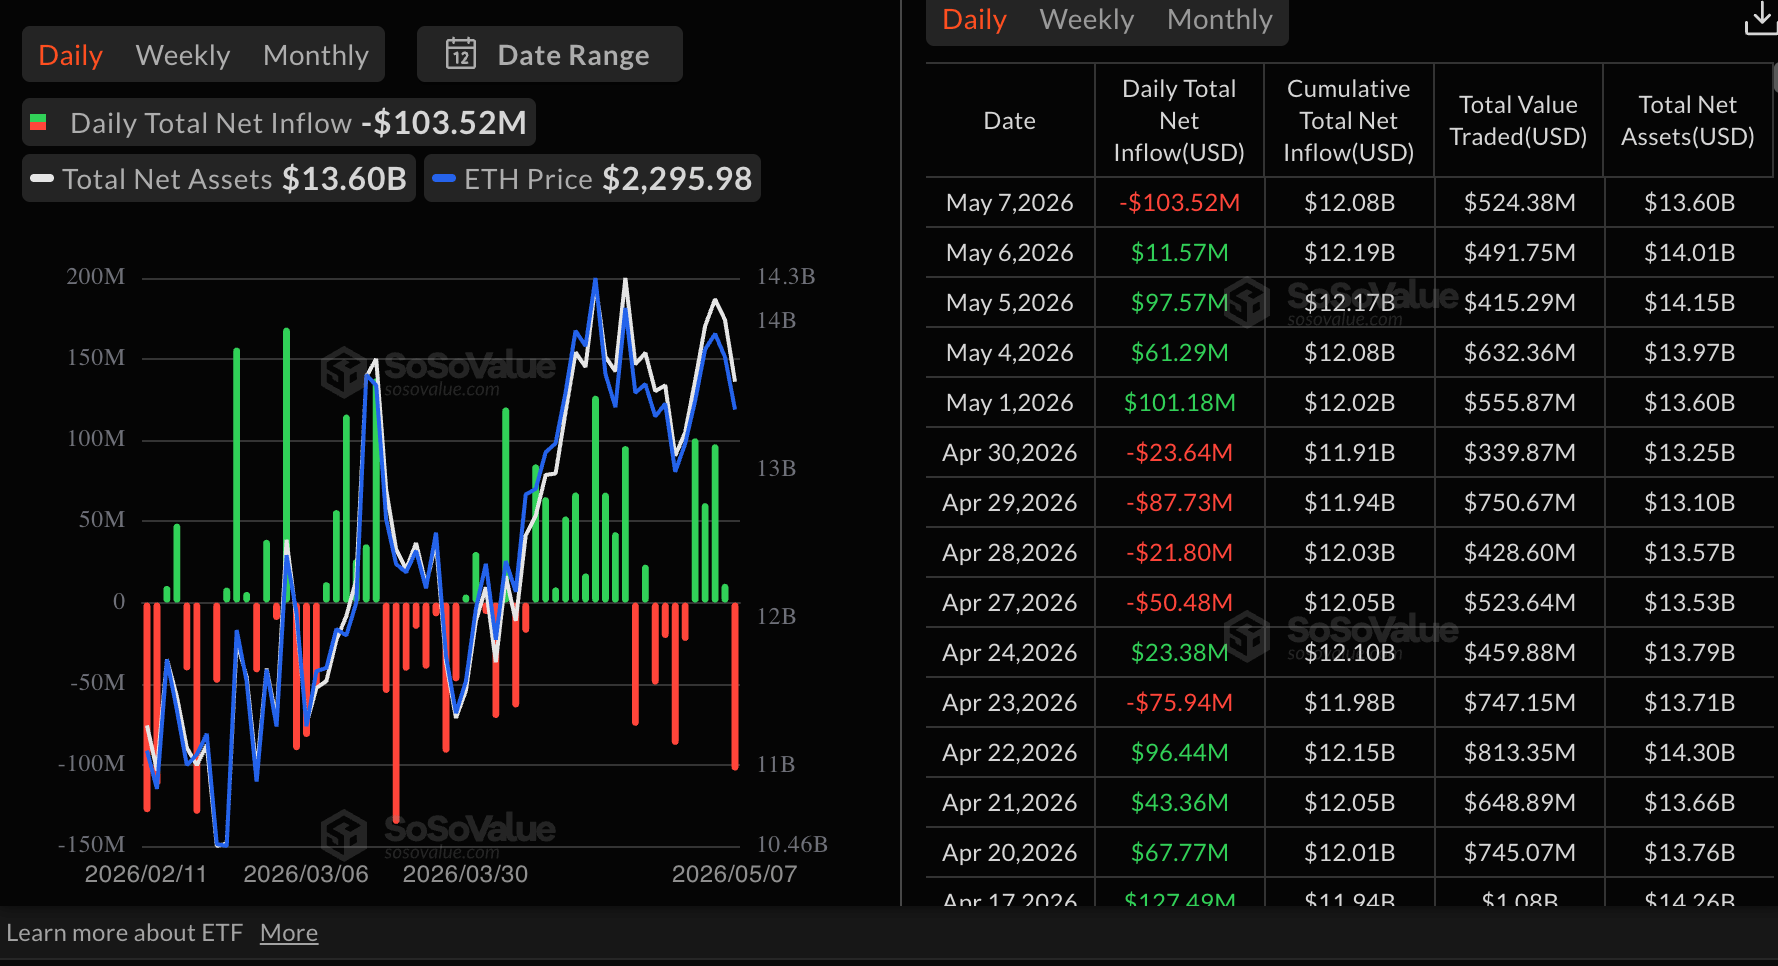
- Ethereum slides toward the 50-day EMA support amid increasing selling pressure and institutional outflows.
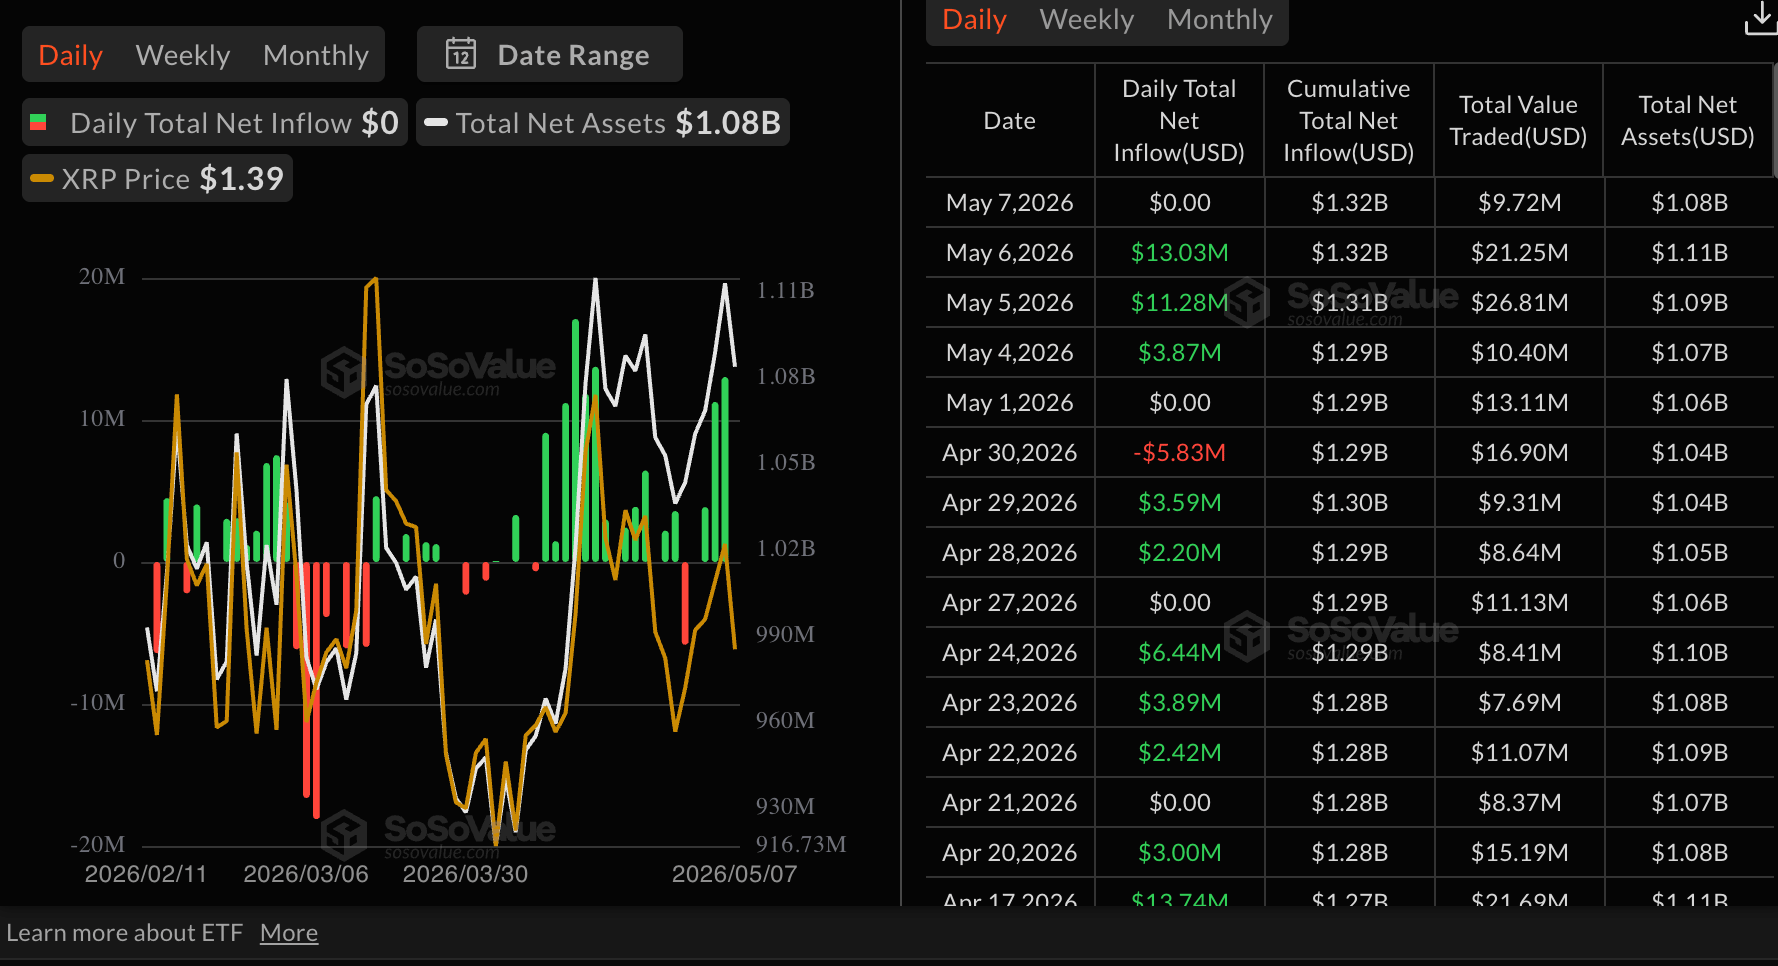
- XRP extends broad sideways action between support at $1.30 and resistance at $1.50 amid muted ETF activity.
Bitcoin (BTC) is correcting for the second consecutive day, trading below the pivotal $80,000 threshold on Friday. The Crypto King started the week on a bullish note, alongside major cryptocurrencies such as Ethereum (ETH) and Ripple (XRP). The path of lease resistance shifted downward after rejection at $82,850 by mid-week.
Ethereum, like Bitcoin, is showing technical weakness, trading below $2,300, while XRP struggles to regain momentum from a daily low at $1.38. The broad risk-off mood can be attributed to profit-taking and resistance in overhead supply, among other factors.
Institutional demand fades amid ETF outflows
Bitcoin spot Exchange-Traded Funds (ETFs) experienced outflows totaling $278 million on Thursday, breaking five consecutive days of inflows, according to SoSoValue. Despite the drawdown, cumulative inflows stand at $59.49 billion, with net assets averaging $106.77 billion.
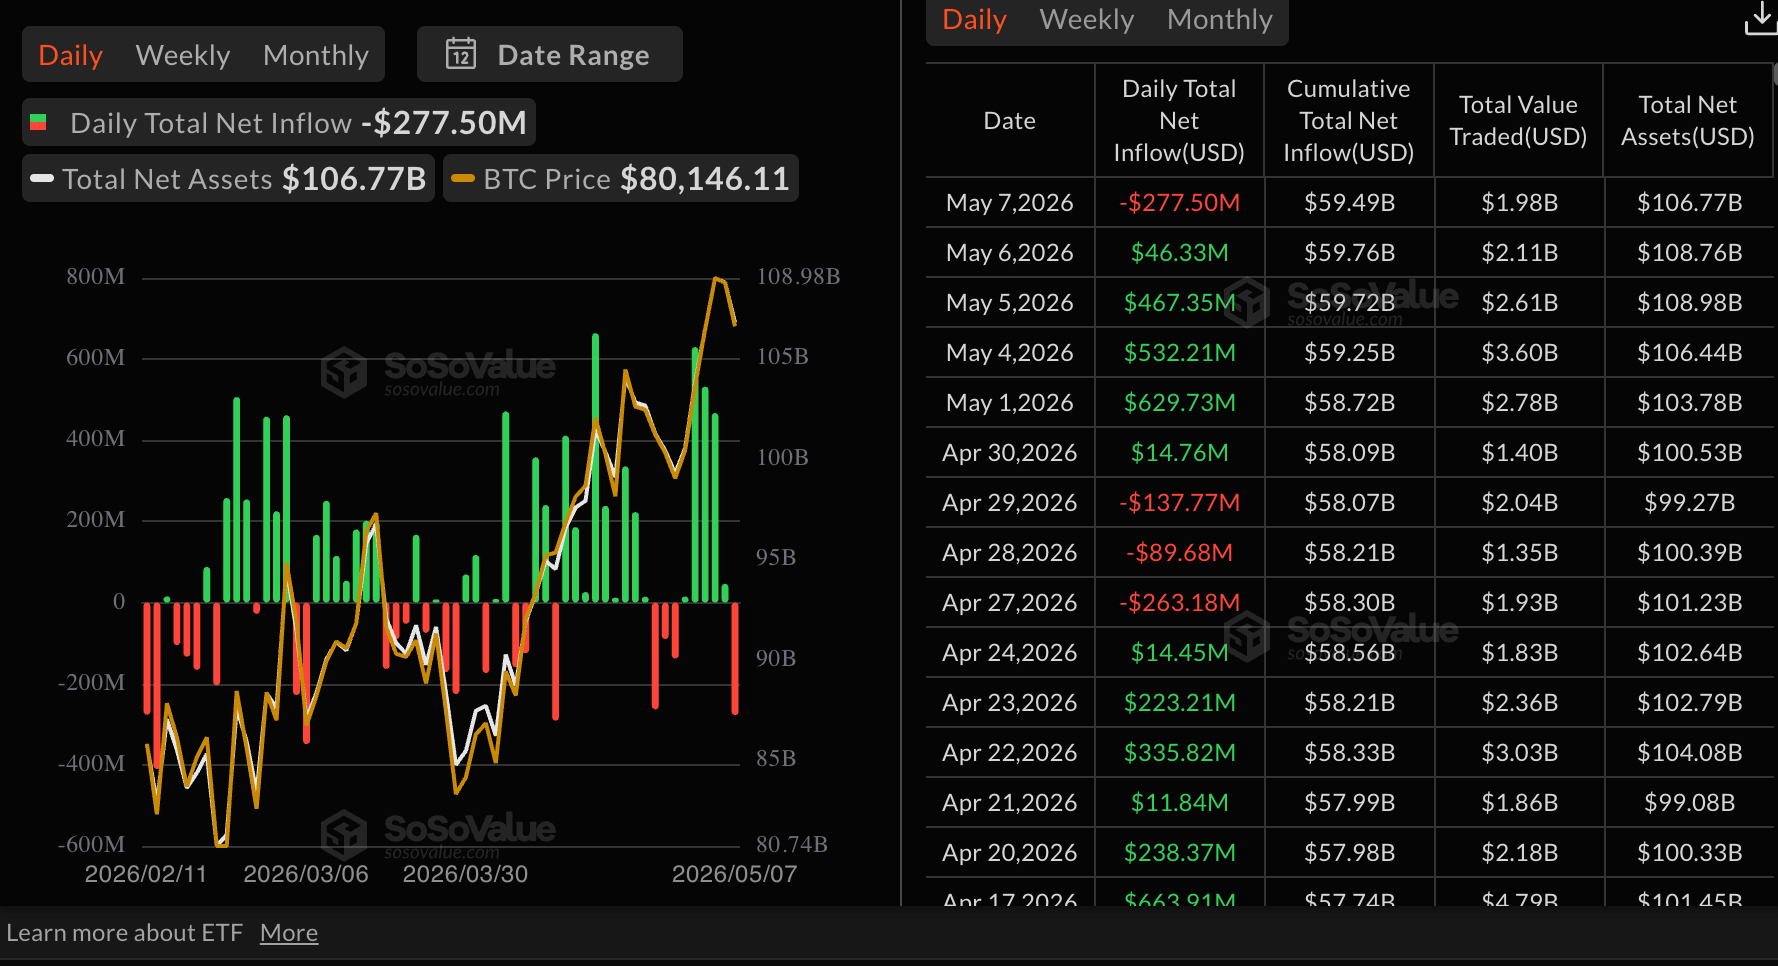
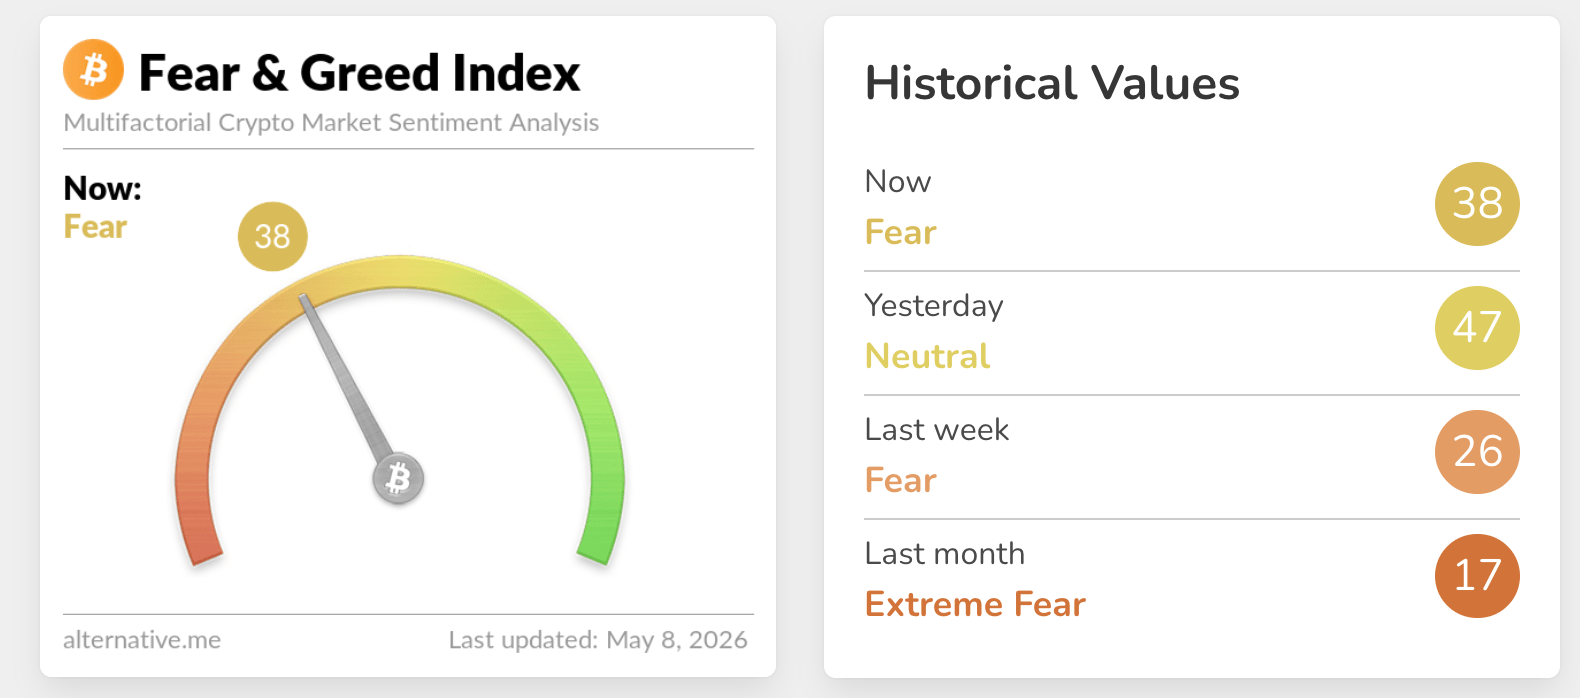
The overall market sentiment weakens further, with the Crypt Fear & Greed Index holding at 38 in the fear territory as of writing, down from 47 in the neutral region the previous day. If risk-off sentiment persists, capital flight from ETFs and derivatives could weigh on Bitcoin, limiting recovery potential.
Ethereum spot ETFs also experienced headwinds with outflows totaling $104 million on Thursday, following four consecutive days of inflows. Cumulative inflows currently average $12.08 billion, with net assets under management at $13.60 billion.
Meanwhile, XRP spot ETFs remained silent with no flows recorded on Thursday, suggesting that investors remain cautious amid price volatility. Nevertheless, Cumulative inflows stand at $1.32 billion, with net assets under management at $1.08 billion.
Technical outlook: Bitcoin pressured below $80,000 as sellers tighten grip
Bitcoin trades at $79,936, keeping a bullish near-term tone as it holds above the rising cluster of moving averages and the SuperTrend indicator support. The pair trades comfortably above the 50-day and 100-day Exponential Moving Averages (EMAs) at $75,341 and $76,255, respectively, while the SuperTrend near $75,523 and the upward trendline support near $78,106 reinforce an underlying bid.
Momentum stays constructive, with the Relative Strength Index (RSI) hovering in bullish territory around 62 on the daily chart and the Moving Average Convergence Divergence (MACD) histogram slightly positive, suggesting upside pressure remains in place despite recent consolidation.
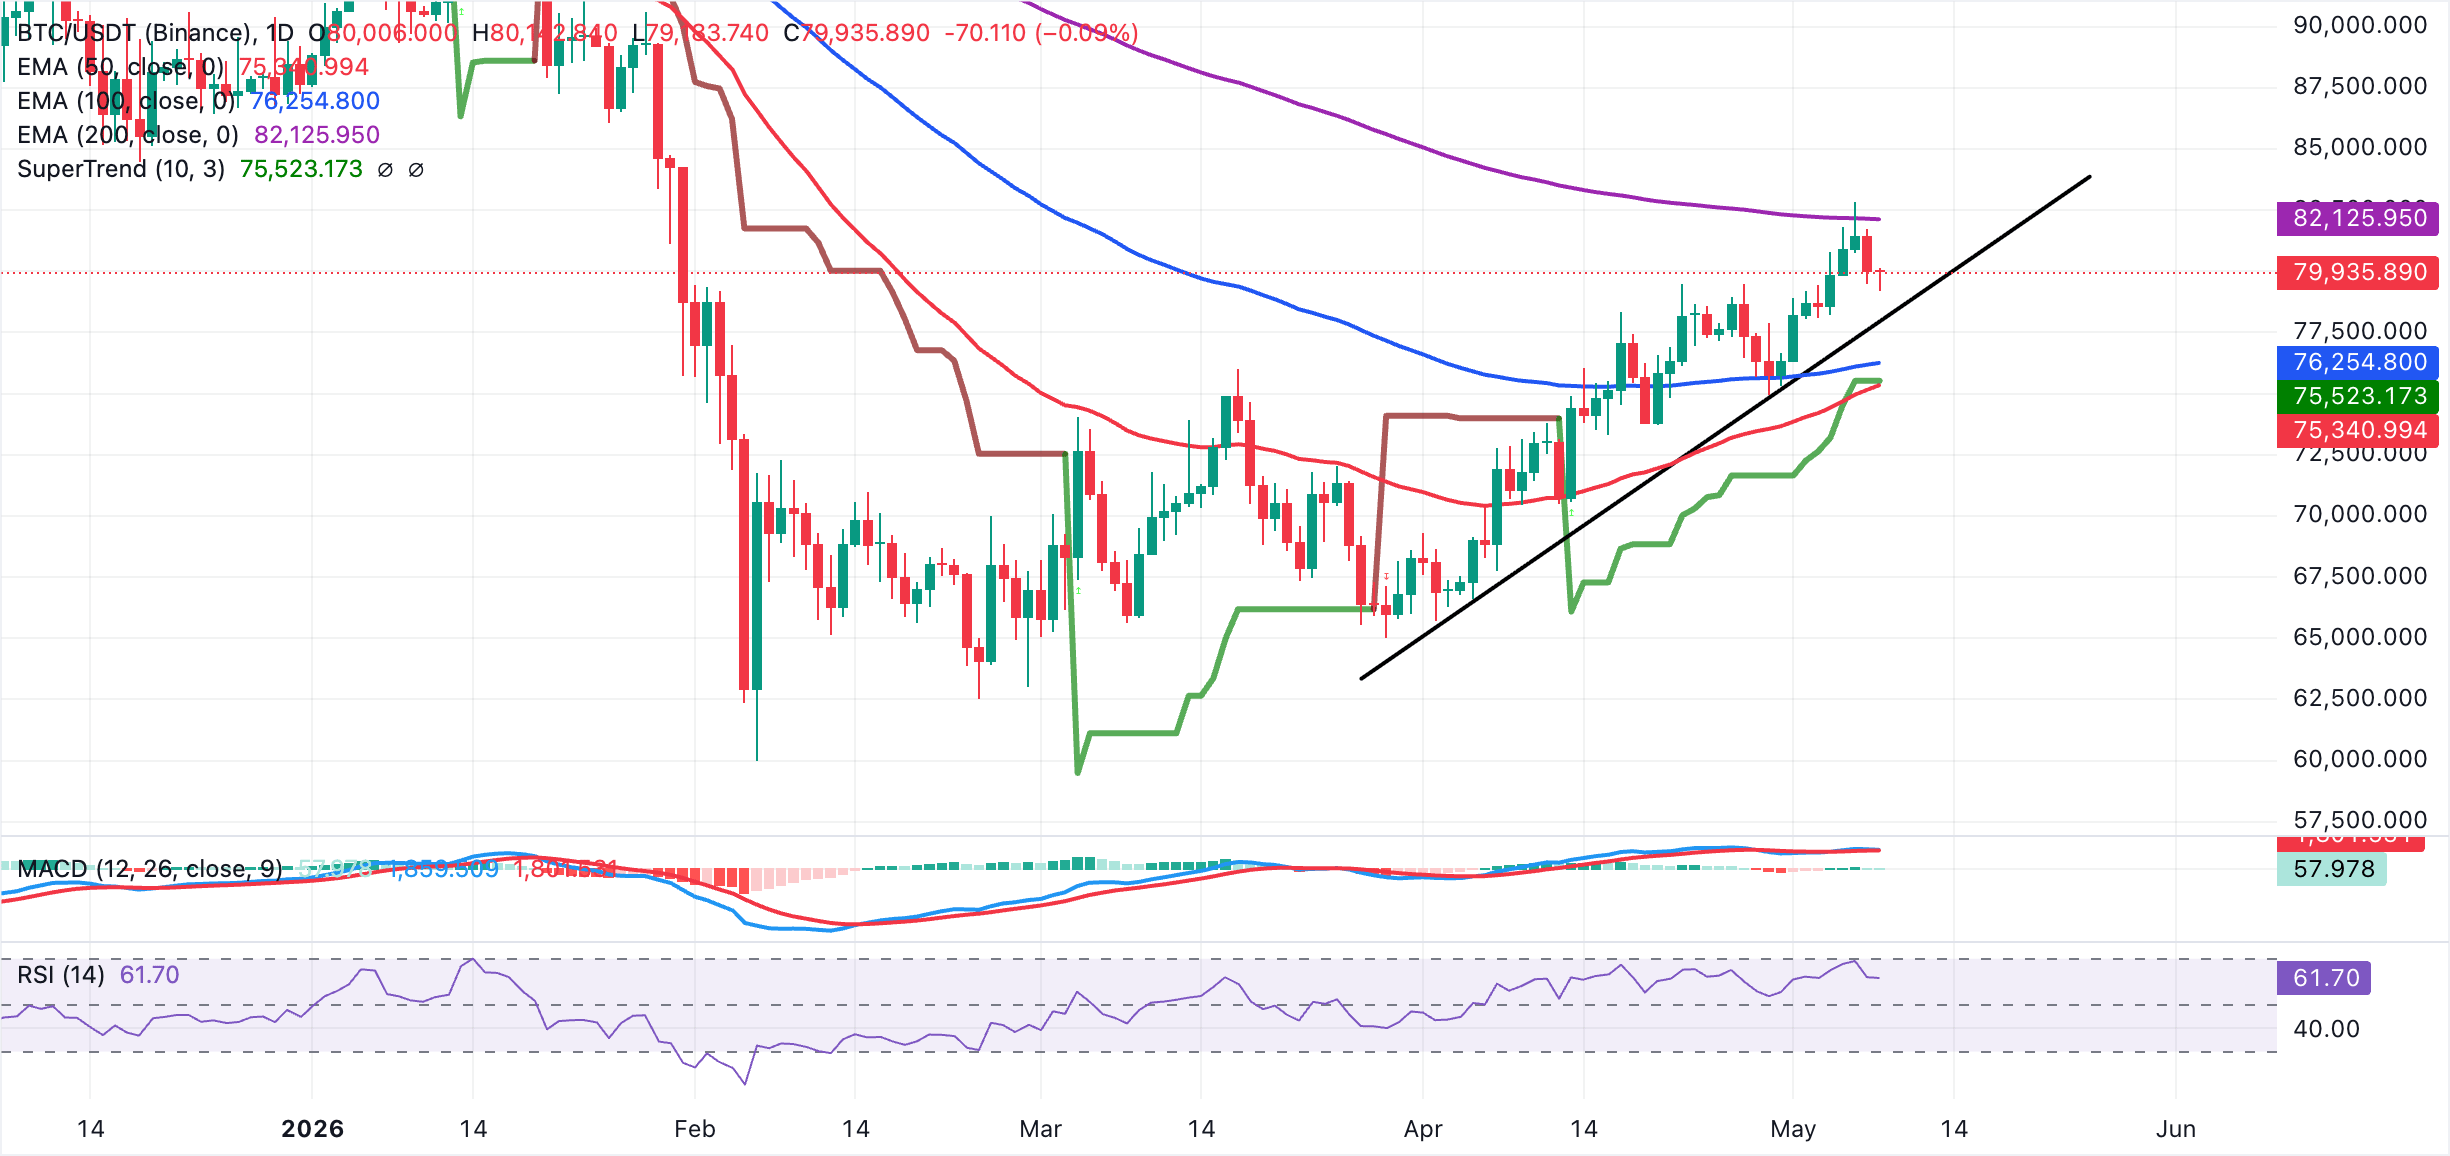
On the topside, initial resistance is defined by the 200-day EMA around $82,126, and a clear break above this longer-term barrier would open the way for a continuation of the broader uptrend. On the downside, immediate support first emerges at the ascending trendline near $78,106, with deeper demand seen at the SuperTrend band and the 50-day and 100-day EMAs clustered between roughly $75,500 and 76,300. A daily close below this zone would ease the current bullish bias and signal a deeper corrective phase.
Altcoins technical outlook: Ethereum, XRP risk deeper losses
Ethereum trades at $2,286, holding above the 50-day EMA at $2,265 and the SuperTrend support near $2,145, hinting at a cautiously constructive tone despite trading beneath the longer-term 100-day and 200-day EMAs at $2,347 and $2,546, respectively.
Momentum is mixed, as the RSI hovers around the neutral 49 area on the daily chart while the MACD histogram remains in negative territory, suggesting upside attempts could still face headwinds while the price stays under these higher averages.
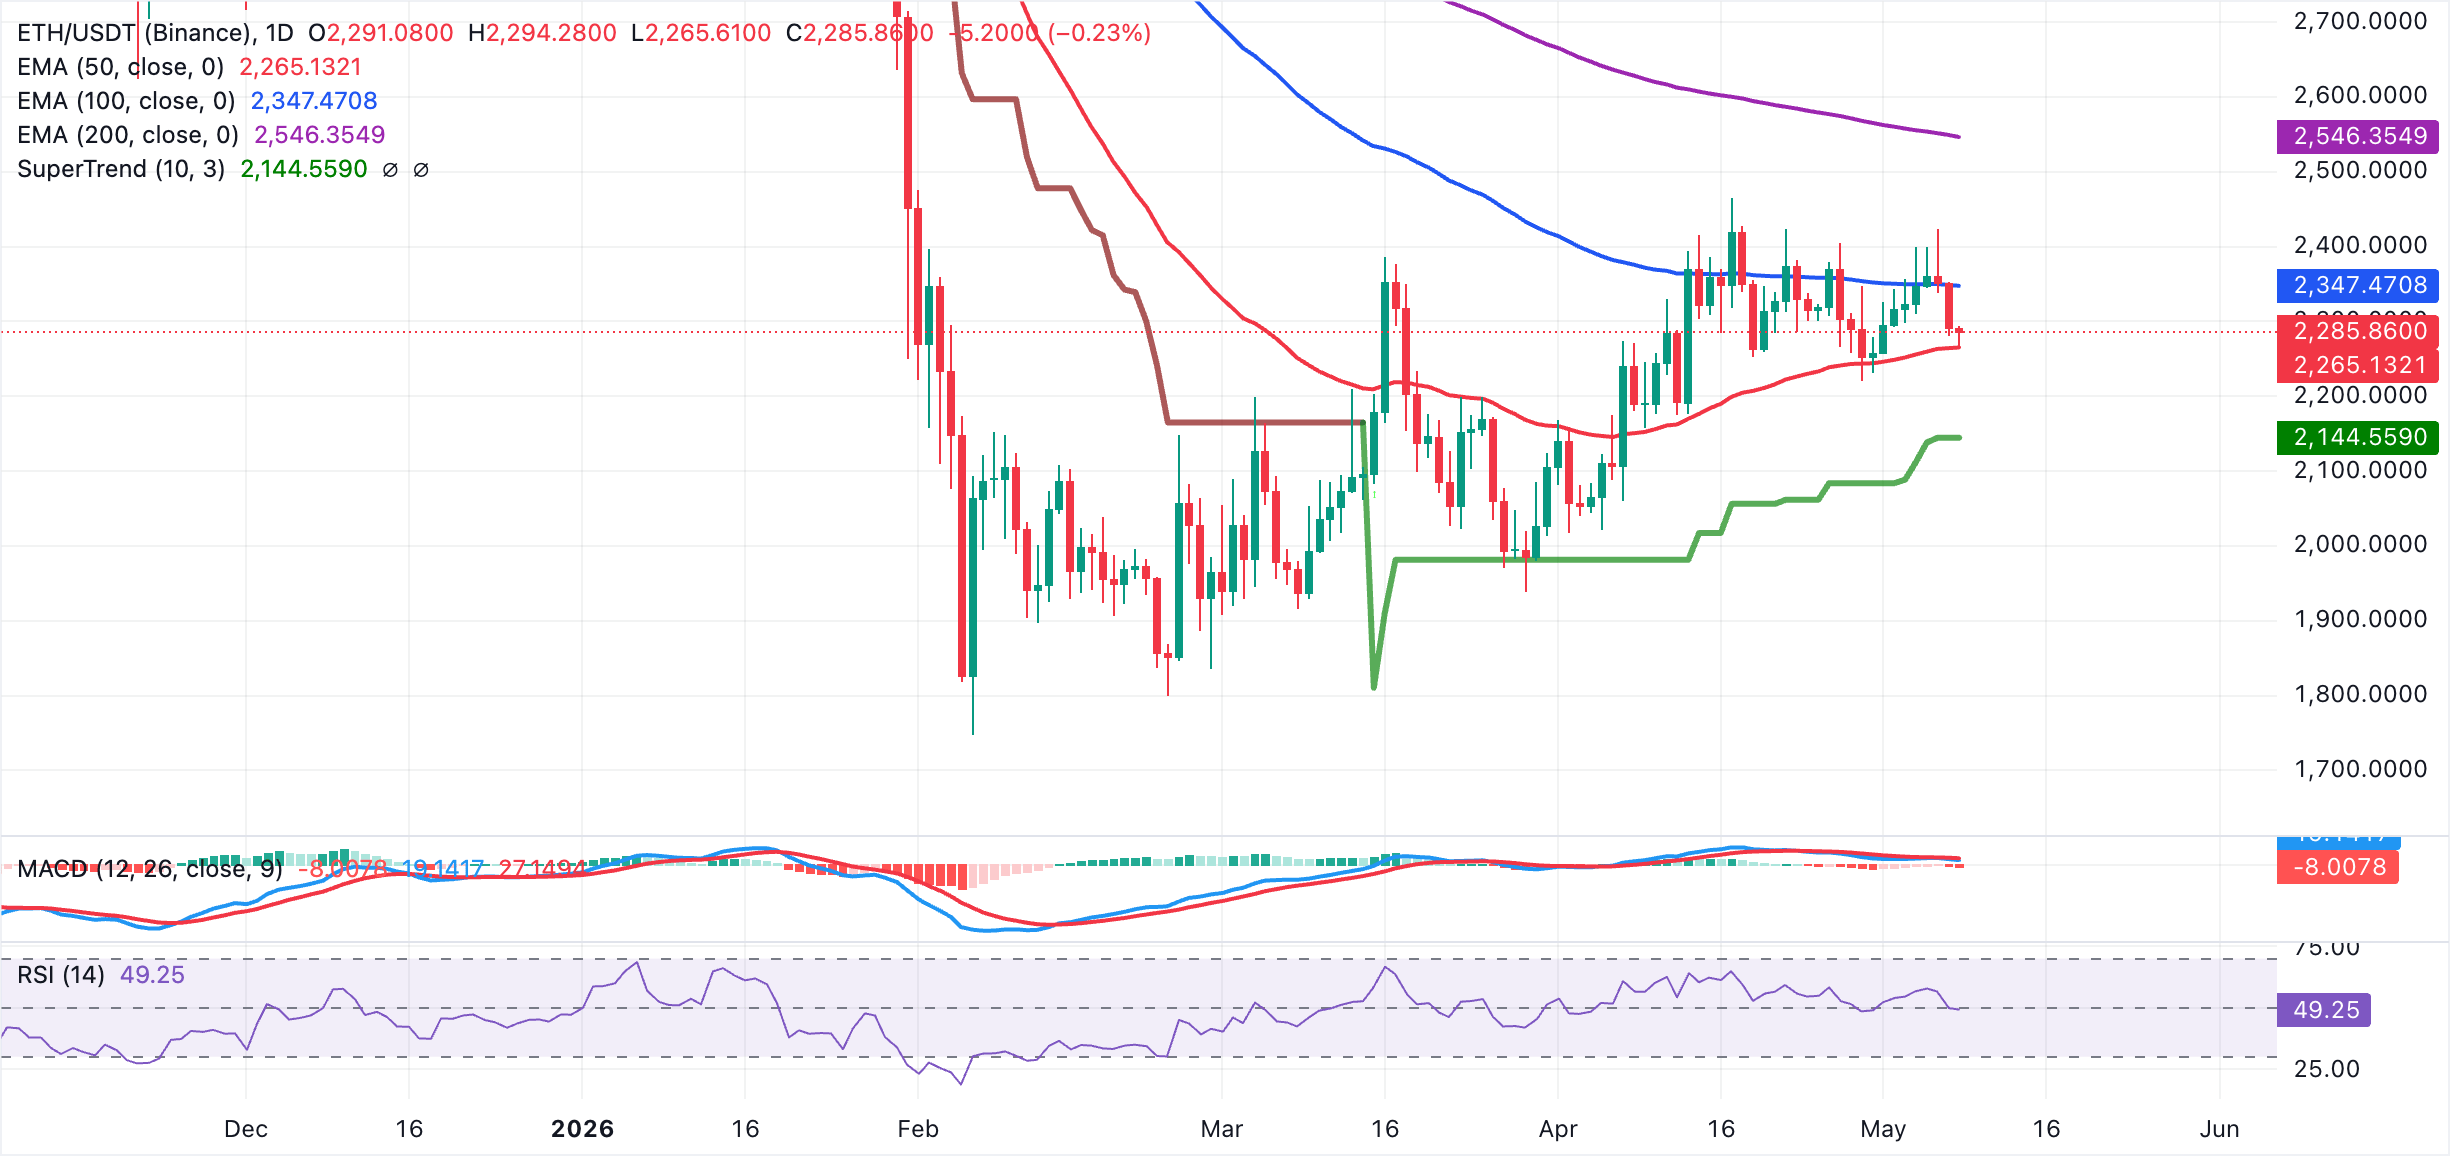
On the topside, initial resistance lies at the 100-day EMA around $2,347, with a sustained break exposing the 200-day EMA at $2,546 as the next bullish objective. On the downside, immediate support is provided by the 50-day EMA at $2,265, while a daily close below there would put the SuperTrend line near $2,145 back in focus as a deeper support zone.
XRP, on the other hand, is trading at $1.38 at the time of writing on Friday. The remittance token holds above the SuperTrend support near $1.32 but remains capped by a dense band of moving averages, starting with the 50-day EMA hovering around $1.41. The 100-day and 200-day EMAs are well above the spot price, which collectively maintains a bearish near-term bias.
At the same time, the RSI oscillates just below the midline on the daily chart, while the MACD lingers marginally in negative territory, suggesting subdued momentum and reinforcing the idea of a market consolidating within a broader downside context.
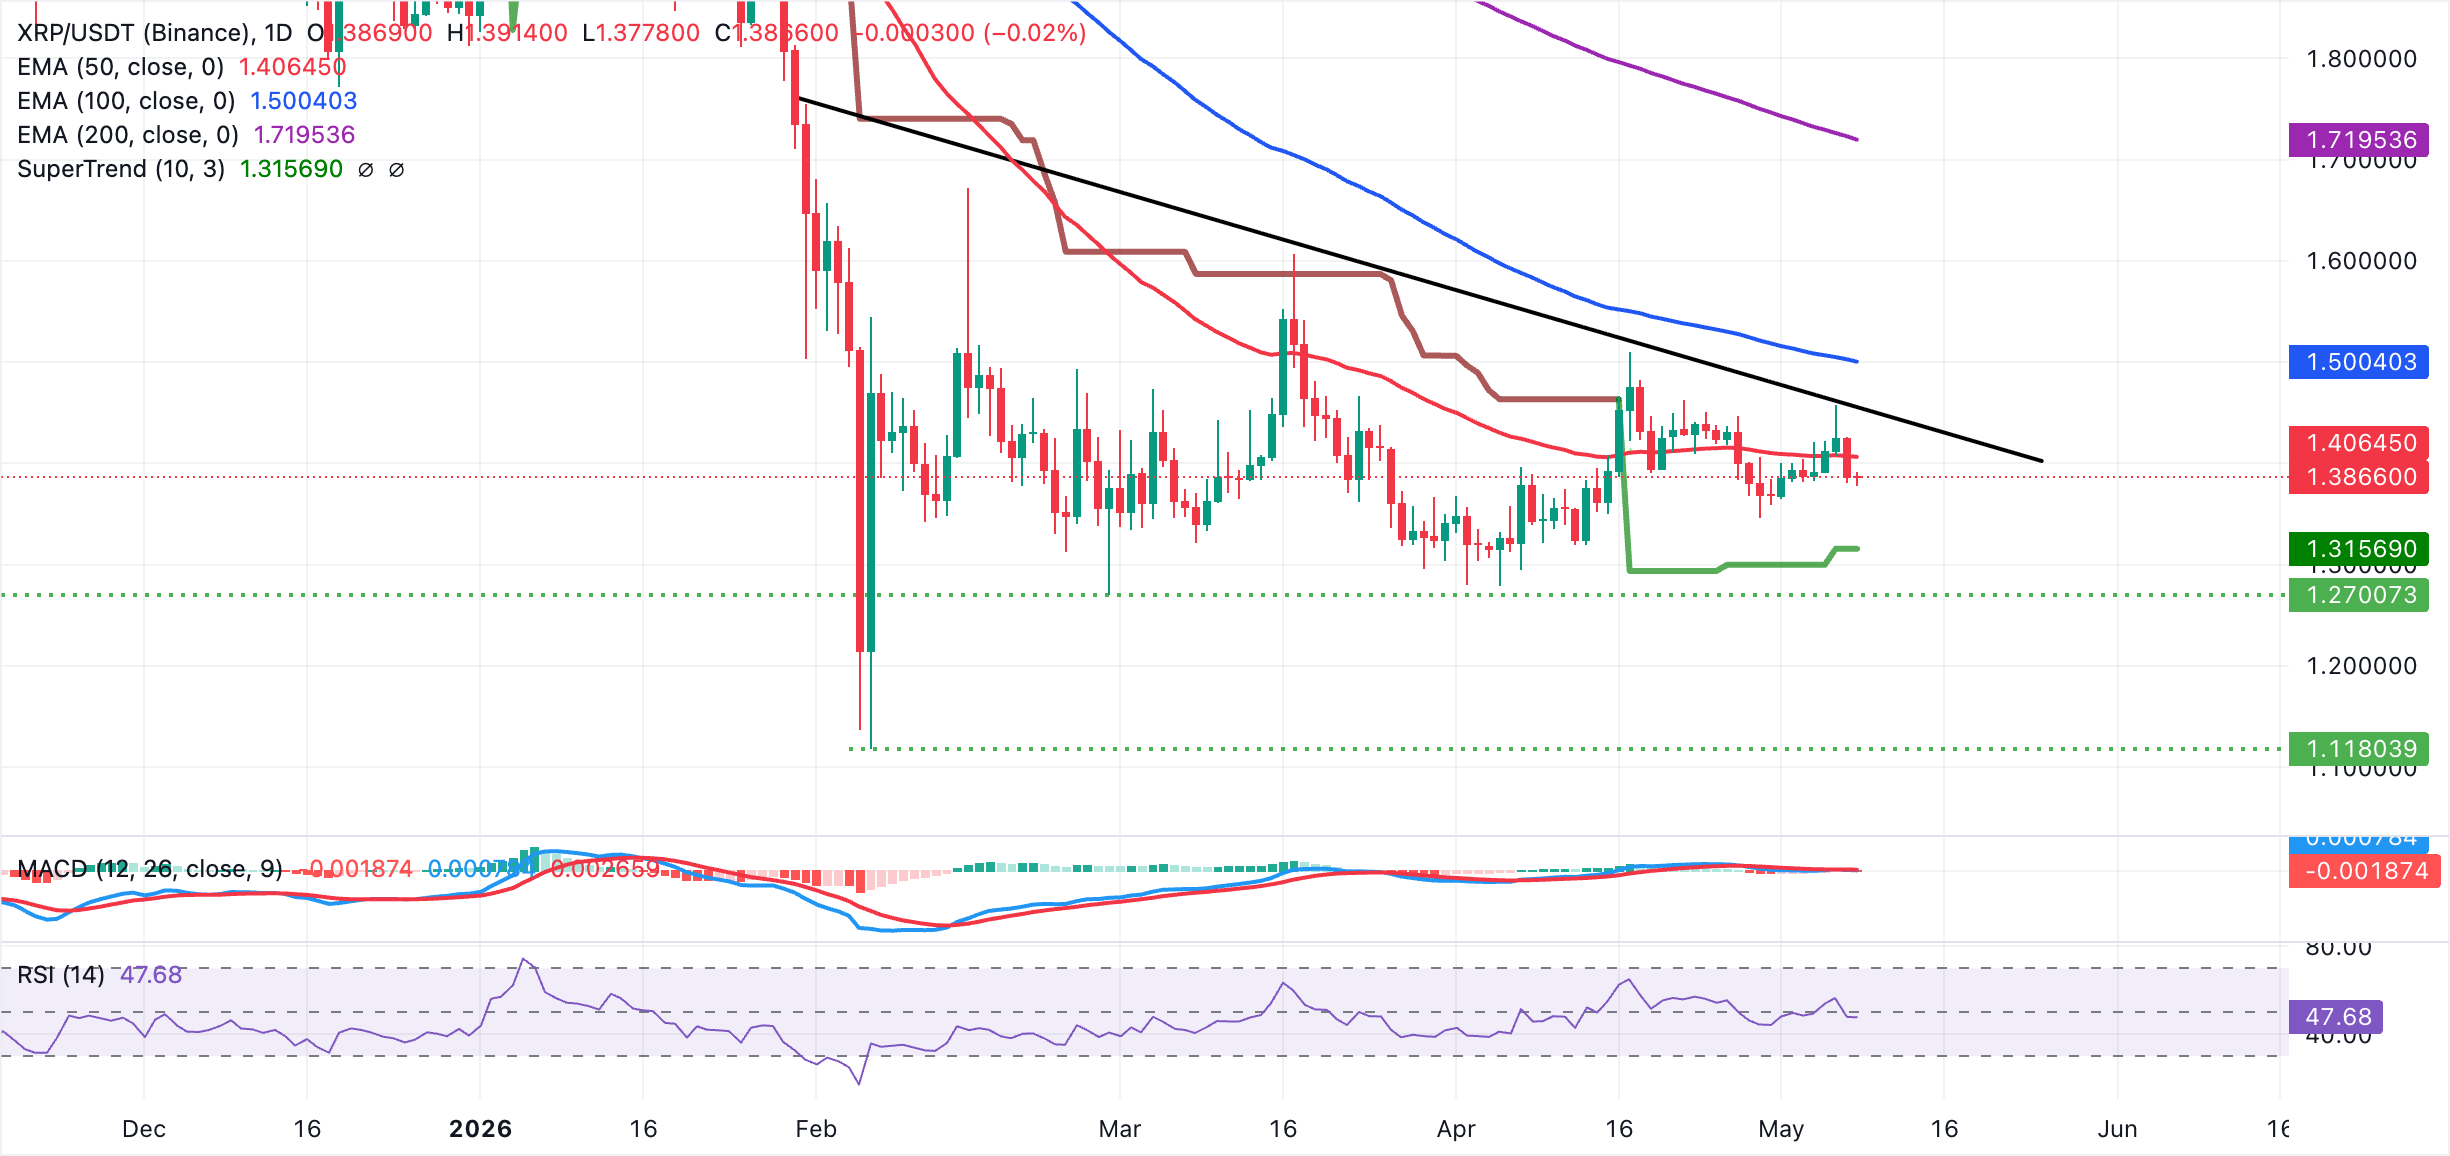
On the topside, initial resistance is seen at the 50-day EMA at $1.41, with further upside constrained by the downwards sloping trendline break level around $1.45. A daily close above this zone would be needed to ease the current bearish cap and open the way toward the 100-day EMA near $1.50 and, beyond that, the 200-day EMA around $1.72.
On the downside, immediate support aligns with the SuperTrend level at $1.32, and a break beneath this floor would expose the pair to deeper losses, keeping sellers in control of the near-term structure.
(The technical analysis of this story was written with the help of an AI tool.)
Crypto ETF FAQs
An Exchange-Traded Fund (ETF) is an investment vehicle or an index that tracks the price of an underlying asset. ETFs can not only track a single asset, but a group of assets and sectors. For example, a Bitcoin ETF tracks Bitcoin’s price. ETF is a tool used by investors to gain exposure to a certain asset.
Yes. The first Bitcoin futures ETF in the US was approved by the US Securities & Exchange Commission in October 2021. A total of seven Bitcoin futures ETFs have been approved, with more than 20 still waiting for the regulator’s permission. The SEC says that the cryptocurrency industry is new and subject to manipulation, which is why it has been delaying crypto-related futures ETFs for the last few years.
Yes. The SEC approved in January 2024 the listing and trading of several Bitcoin spot Exchange-Traded Funds, opening the door to institutional capital and mainstream investors to trade the main crypto currency. The decision was hailed by the industry as a game changer.
The main advantage of crypto ETFs is the possibility of gaining exposure to a cryptocurrency without ownership, reducing the risk and cost of holding the asset. Other pros are a lower learning curve and higher security for investors since ETFs take charge of securing the underlying asset holdings. As for the main drawbacks, the main one is that as an investor you can’t have direct ownership of the asset, or, as they say in crypto, “not your keys, not your coins.” Other disadvantages are higher costs associated with holding crypto since ETFs charge fees for active management. Finally, even though investing in ETFs reduces the risk of holding an asset, price swings in the underlying cryptocurrency are likely to be reflected in the investment vehicle too.
Recommended Articles


