


Ripple Price Forecast: XRP extends weekly gains amid growing retail interest and institutional silence
- XRP rebounds above $1.42 amid a generally bearish trend, reinforced by the descending moving averages.
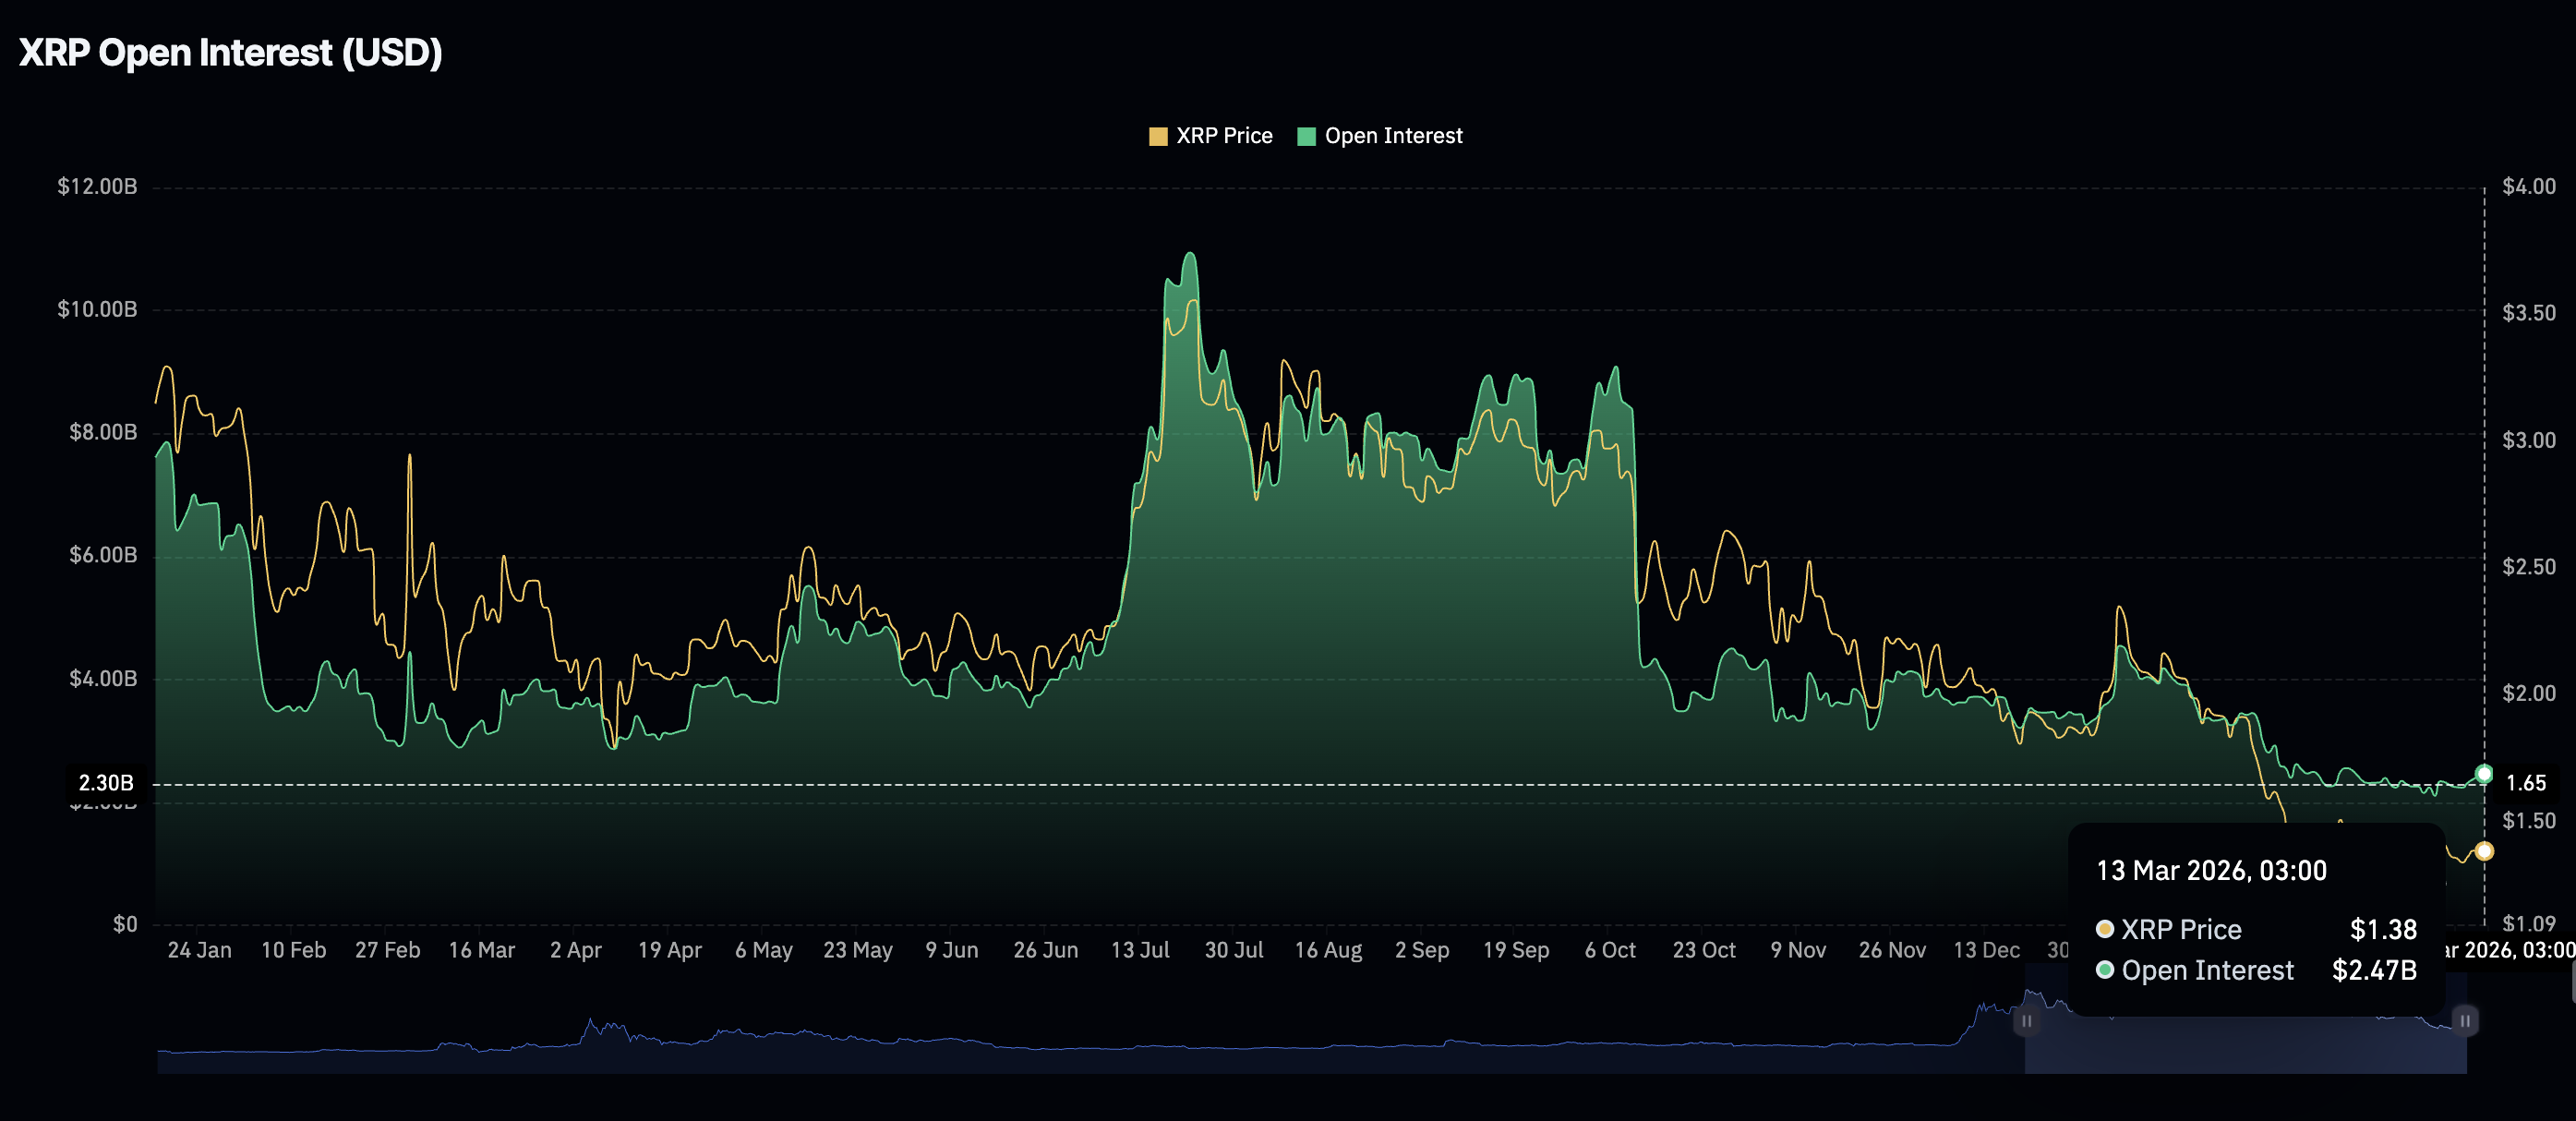
- Retail interest in XRP expands slightly, with futures Open Interest rising to $2.47 billion on Friday.
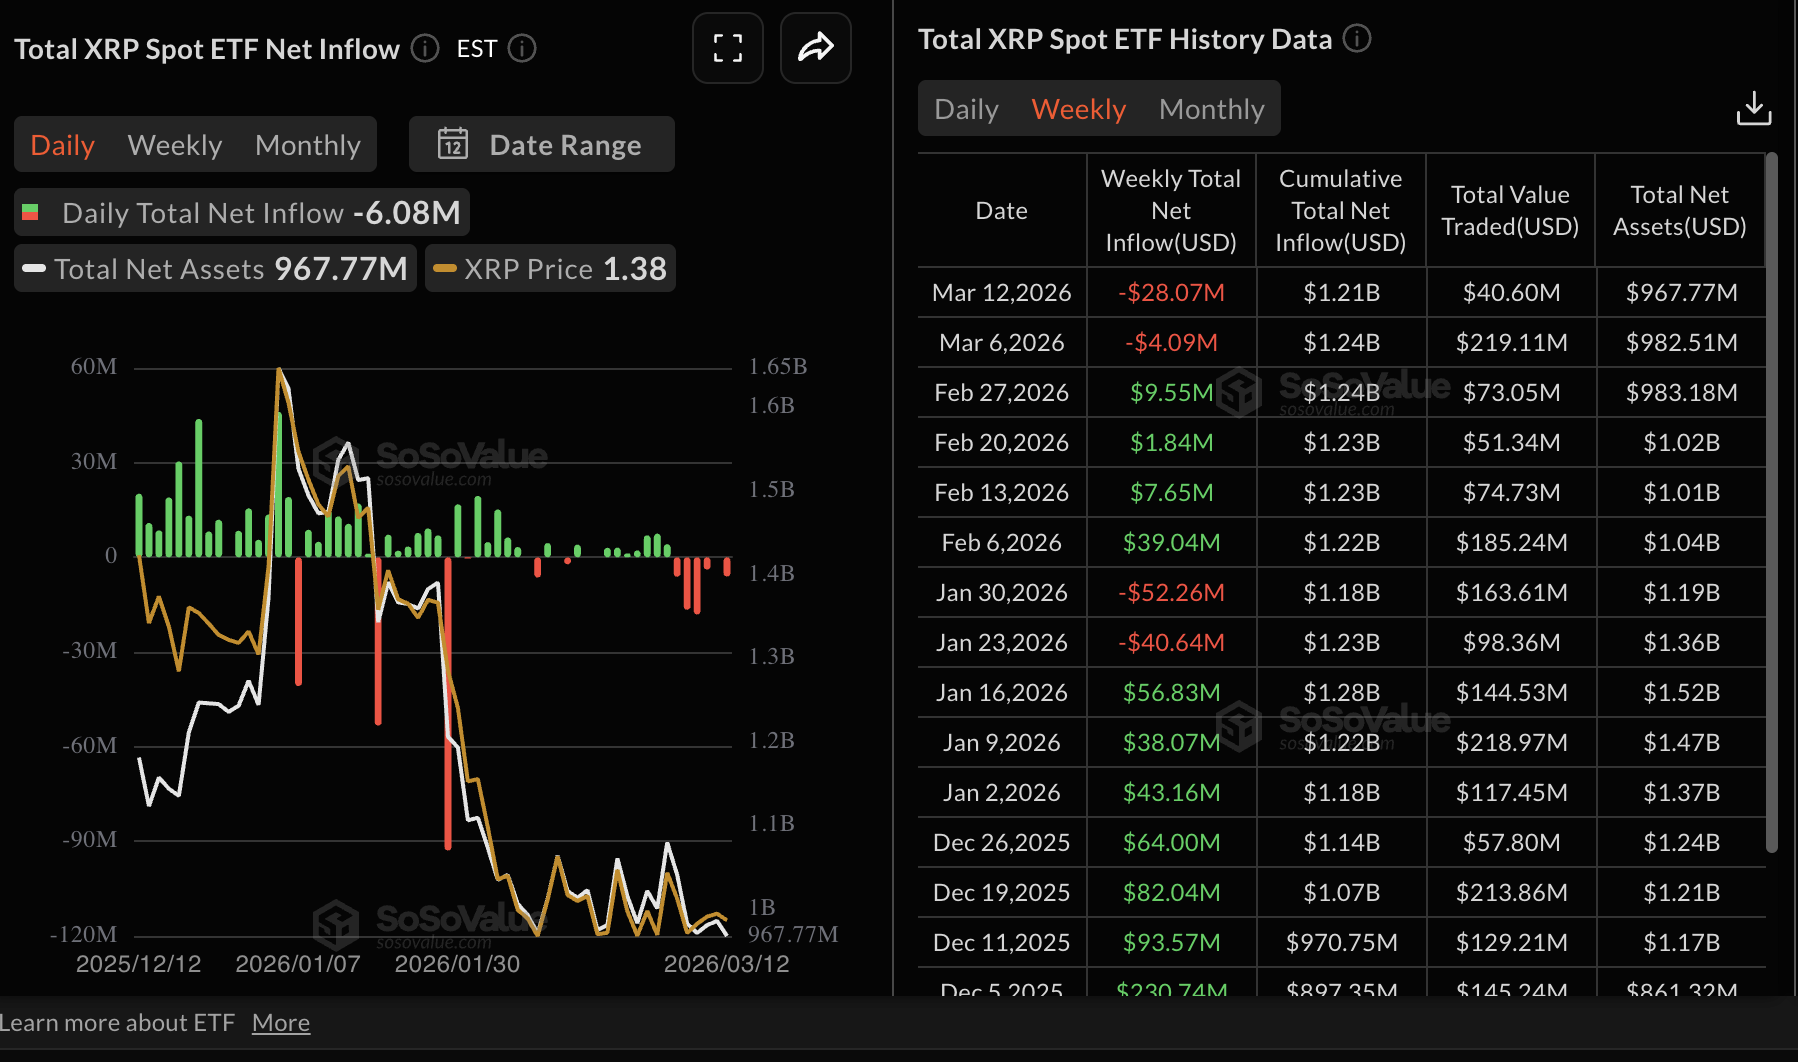
- Demand for US-listed spot ETFs lags, with weekly outflows totaling $28 million through Thursday.
Ripple (XRP) is gaining momentum, trading above $1.42 at the time of writing on Friday. The remittance token’s upswing from its daily open of $1.38 mirrors broader increases in crypto prices, with Bitcoin (ETH) holding above $72,200 and Ethereum (ETH) above $2,100.
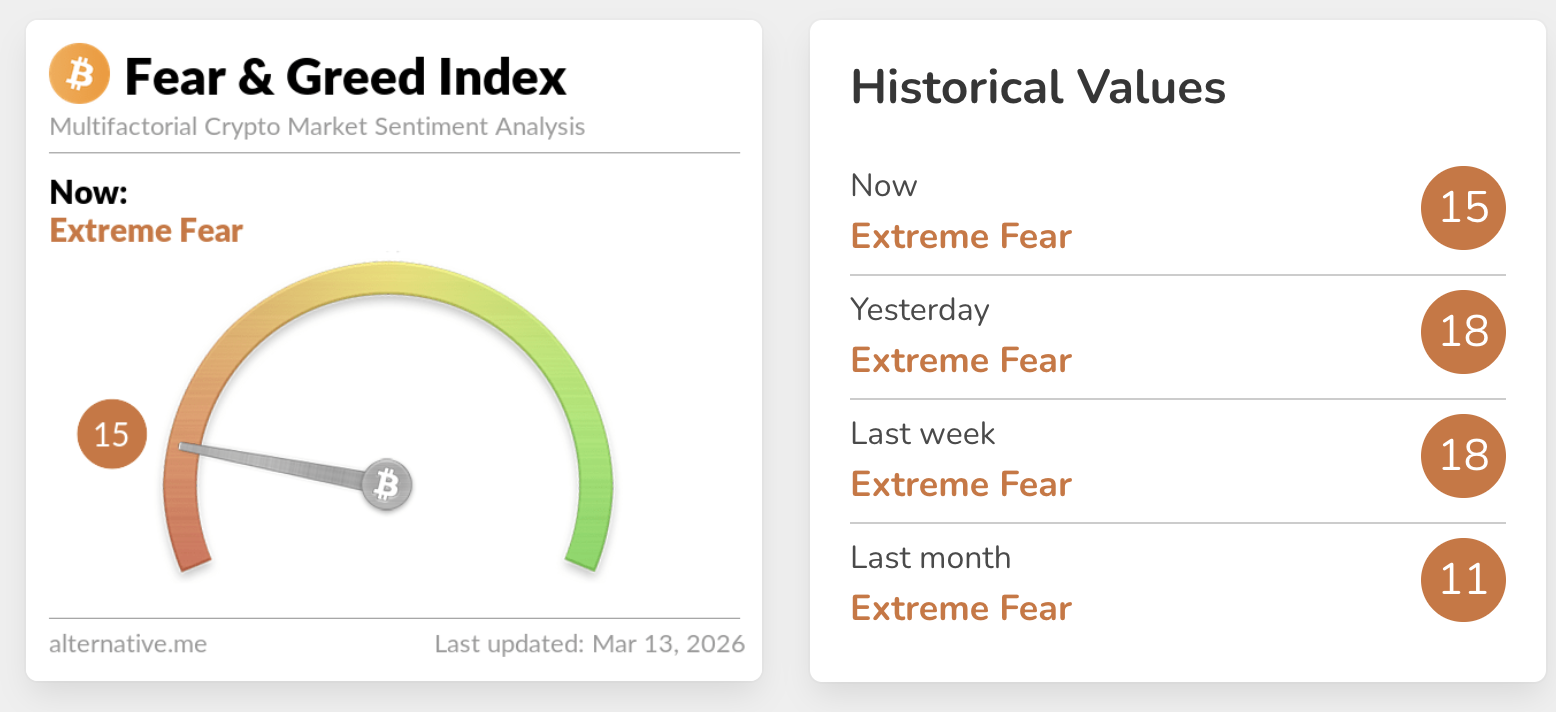
Despite the increase, the Crypto Fear & Greed Index is at 15, down from 18 the previous day, which indicates extreme fear. This outlook implies that crypto prices are rising while sentiment lags, potentially capping gains.
XRP steadies as retail demand returns
The XRP derivatives market shows subtle signs of growing retail demand, as reflected in futures Open Interest (OI), which reached $2.47 billion on Friday, up from $2.43 billion the previous day.
On Monday, the OI, which reflects the notional value of outstanding futures contracts, averaged $2.25, coinciding with XRP trading at $1.33, the weekly low. Therefore, a steady increase in the OI would help support the recovery and increase the chances of XRP swinging above the pivotal $1.54 threshold.
Institutional demand for XRP has taken a back foot this week, as evidenced by spot Exchange-Traded Funds (ETFs), which have recorded outflows totaling $28 million through Thursday. Depending on Friday's activity, XRP could confirm two consecutive weeks of steady outflows.
Meanwhile, cumulative outflows stand at $1.21 billion and net assets under management at $968 million. Net assets have declined from a record high of $1.65 billion, reached on January 1.
Technical outlook: Assessing XRP’s recovery potential
XRP hovers above $1.42, reflecting a neutral to bullish shift in the short-term. Buyers appear intent on attempting to close above a key resistance at around $1.52, supported by the Moving Average Convergence Divergence (MACD) holding above its signal line on the daily chart. The expanding green histogram bars could prompt traders to increase their risk exposure, raising the odds of a steady recovery.
Moreover, the Relative Strength Index (RSI) at 51 on the same chart has advanced from oversold levels toward a more balanced stance, which suggests short-covering rather than a decisive bullish momentum.
A daily close is required above the supply cluster around $1.52, as highlighted by the 50-day Exponential Moving Average (EMA). The SuperTrend lies at $1.54, reinforcing the seller congestion zone. Breaking above this area will be critical for sustaining an extended swing to the 100-day EMA at $1.72 and then the 200-day EMA at $1.97.
-1773406082086-1773406082088.png)
On the downside, initial support lies at $1.38, followed by weekly lows around $1.33, where failure would expose the $1.30 area as the next bearish target. A drop through $1.34 would reassert the broader downtrend and keep sellers in control.
Crypto ETF FAQs
An Exchange-Traded Fund (ETF) is an investment vehicle or an index that tracks the price of an underlying asset. ETFs can not only track a single asset, but a group of assets and sectors. For example, a Bitcoin ETF tracks Bitcoin’s price. ETF is a tool used by investors to gain exposure to a certain asset.
Yes. The first Bitcoin futures ETF in the US was approved by the US Securities & Exchange Commission in October 2021. A total of seven Bitcoin futures ETFs have been approved, with more than 20 still waiting for the regulator’s permission. The SEC says that the cryptocurrency industry is new and subject to manipulation, which is why it has been delaying crypto-related futures ETFs for the last few years.
Yes. The SEC approved in January 2024 the listing and trading of several Bitcoin spot Exchange-Traded Funds, opening the door to institutional capital and mainstream investors to trade the main crypto currency. The decision was hailed by the industry as a game changer.
The main advantage of crypto ETFs is the possibility of gaining exposure to a cryptocurrency without ownership, reducing the risk and cost of holding the asset. Other pros are a lower learning curve and higher security for investors since ETFs take charge of securing the underlying asset holdings. As for the main drawbacks, the main one is that as an investor you can’t have direct ownership of the asset, or, as they say in crypto, “not your keys, not your coins.” Other disadvantages are higher costs associated with holding crypto since ETFs charge fees for active management. Finally, even though investing in ETFs reduces the risk of holding an asset, price swings in the underlying cryptocurrency are likely to be reflected in the investment vehicle too.
(The technical analysis of this story was written with the help of an AI tool.)
Recommended Articles


