


Bitcoin Price Forecast: BTC steadies near key support as rising Oil prices cloud outlook
- Bitcoin price steadies near the lower consolidation boundary on Monday after being rejected at the key resistance level last week.
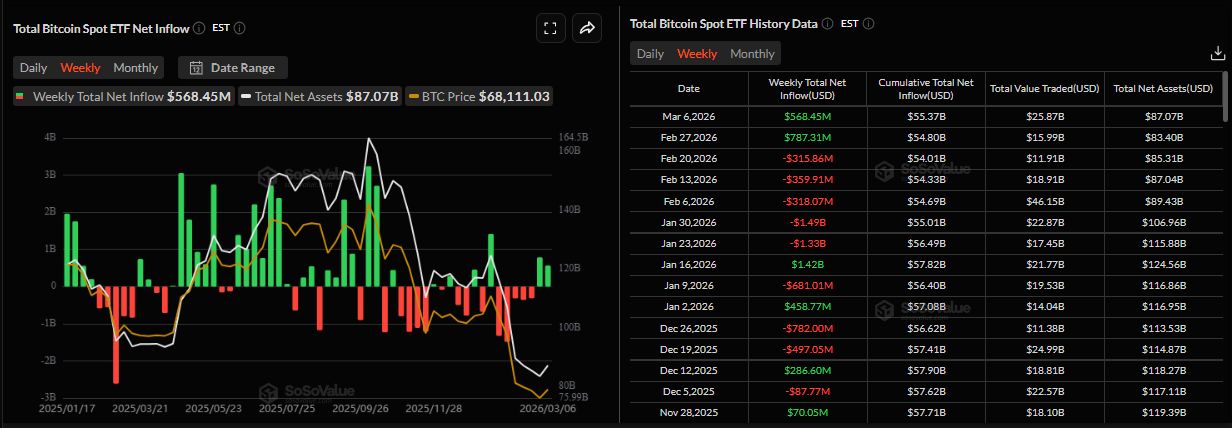
- US-listed spot ETFs recorded an inflow of over $500 million last week, marking the second consecutive week of positive flows.
- Rising Oil prices amid the prolonged US–Iran conflict could push global inflation higher, potentially weighing on risky assets like BTC.
Bitcoin (BTC) hovers near the lower boundary of its consolidation range around $67,000 as of Monday, after being rejected from the key resistance zone last week. Institutional demand provides mild support in BTC as spot Exchange Traded Funds (ETFs) recorded their second consecutive week of positive flows. Despite these positive inflows, market participants should be cautious as prolonged US–Iran war has pushed Oil prices to their highest level since mid-June 2022, raising concerns about renewed inflationary pressures that could weigh on risk-sensitive assets such as BTC.
Why rising Oil prices could hurt risky assets?
The US-Iran war reached its 10-day mark on Monday, a prolonged conflict that has put pressure on global investors, weighed on risk sentiment, and capped the Crypto King price.
Over the weekend, new events further dampened risk appetite as the US and Israel, in a joint operation, struck several Iranian depots.
Oil prices were already surging after Iran closed the Strait of Hormuz last week, which disrupted oil shipping routes and constrained global supply.
The weekend strikes on depots further tightened supply conditions, sending West Texas Intermediate (WTI) to $113.28 during the Asian trading session on Monday, a level not seen since mid-June 2022.
As of writing, WTI is slightly correcting, with the International Energy Agency (IEA) reportedly discussing a coordinated release of emergency oil reserves among G7 member countries to stabilize markets. The release of emergency oil reserves by countries coordinated through the IEA could add temporary supply to the market and cap the sharp spike in oil prices.
However, while these developments could provide short-term relief, the long-term impact remains a concern for the market. A steady and prolonged rise in Oil prices adds upward pressure on global inflation as higher energy costs ripple through transportation and production, raising the costs of goods and services. This could create a high-inflation environment, putting pressure on central banks worldwide to tighten monetary policy.
These developments would hurt risky assets such as Bitcoin, as high borrowing costs reduce market liquidity and steer markets towards safer, yield-bearing assets.
Institutional demand remains robust
Institutional demand for Bitcoin remained robust last week, indicating mild investor confidence despite ongoing geopolitical tensions and uncertainty. According to SoSoValue data, spot Bitcoin ETFs recorded inflows of $568.45 million last week, following $787.31 million positive flows the previous one. If these inflows continue and intensify, BTC could see a recovery in the upcoming weeks.
Could Bitcoin serve as "digital gold" narrative?
QCP Capital reported on Monday that, amid rising uncertainty, global equity markets have turned defensive.
“That said, US Treasuries and Gold also failed to provide their usual haven bid, with both coming under pressure as surging crude prices stoke inflation fears and push yields higher. Instead, the US dollar has emerged as the preferred defensive asset, supported by elevated yields and the US’s status as a net energy exporter,” said the analyst.
The report further explained that despite broad-based weakness in risk assets amid heightened market stress, BTC has been notably resilient, a pattern the crypto market has not seen in some time.
The report concluded that, while BTC has yet to fully live up to its “digital gold” narrative, its practical use as a “digital escape hatch” is becoming increasingly relevant, particularly in Gulf countries amid episodes of currency volatility and political uncertainty. Although its long-term trajectory remains uncertain, recent price action amid escalating tensions suggests growing recognition of this function.
Bitcoin Price Forecast: BTC fails to close above the 200-week EMA
Bitcoin price is trading at $67,600 as of Monday. The near-term bias is mildly bearish as price holds below the 50-week Exponential Moving Average (EMA) near $90,000 and the 100-week EMA around $84,000, while clinging to the flattening 200-week EMA.
The Relative Strength Index (RSI) on the weekly chart at 29 sits in oversold territory but remains depressed, suggesting lingering downside pressure rather than a clean inflection. The Moving Average Convergence Divergence (MACD) remains below the signal line and the zero mark, even as the histogram has been contracting, which suggests fading bearish momentum rather than an established reversal.
Immediate support is seen at the $60,000 horizontal level, reinforced by a rising trendline zone near $55,500, where buyers would be expected to defend the broader cycle structure. A sustained break below $60,000 would expose deeper retracement levels, with the 61.8% Fibonacci retracement of the $49,000–$126,200 advance at roughly $78,490 already lost and now reinforcing the bearish tone.
On the topside, initial resistance aligns with the 23.6% retracement near $108,000, followed by the prior congestion band around $115,000, and only a weekly close back above this area would start to neutralize the current downside bias.
-1773045715432-1773045715433.png)
On the daily chart, BTC price is holding in a parallel channel, capped near $71,980, keeping a mild bearish bias intact despite the recent rebound toward the mid-band. BTC trades well below the 50- and 100-day EMAs at $73,263 and $80,648, respectively, so the broader trend remains negative.
The RSI on the daily chart is at 46, below the 50 midline, signalling soft momentum and aligning with the broader negative tone. The MACD line remains above the signal line, though the recent contraction from earlier highs suggests fading upside pressure rather than fresh acceleration.
Immediate resistance emerges at the channel top around $71,980, where rejection would preserve the short-term downward structure and keep sellers engaged. A daily close above this barrier would open the way toward the $73,000 area, where prior consolidation could slow gains.
On the downside, initial support is defined by the channel floor near $65,120, with a break lower exposing the psychological $60,000 horizontal line as the next key level. As long as the Crypto King trades between $65,120 and $71,980, the pair remains in a corrective bearish channel.
-1773045732263-1773045732264.png)
(The technical analysis of this story was written with the help of an AI tool.)
Bitcoin, altcoins, stablecoins FAQs
Bitcoin is the largest cryptocurrency by market capitalization, a virtual currency designed to serve as money. This form of payment cannot be controlled by any one person, group, or entity, which eliminates the need for third-party participation during financial transactions.
Altcoins are any cryptocurrency apart from Bitcoin, but some also regard Ethereum as a non-altcoin because it is from these two cryptocurrencies that forking happens. If this is true, then Litecoin is the first altcoin, forked from the Bitcoin protocol and, therefore, an “improved” version of it.
Stablecoins are cryptocurrencies designed to have a stable price, with their value backed by a reserve of the asset it represents. To achieve this, the value of any one stablecoin is pegged to a commodity or financial instrument, such as the US Dollar (USD), with its supply regulated by an algorithm or demand. The main goal of stablecoins is to provide an on/off-ramp for investors willing to trade and invest in cryptocurrencies. Stablecoins also allow investors to store value since cryptocurrencies, in general, are subject to volatility.
Bitcoin dominance is the ratio of Bitcoin's market capitalization to the total market capitalization of all cryptocurrencies combined. It provides a clear picture of Bitcoin’s interest among investors. A high BTC dominance typically happens before and during a bull run, in which investors resort to investing in relatively stable and high market capitalization cryptocurrency like Bitcoin. A drop in BTC dominance usually means that investors are moving their capital and/or profits to altcoins in a quest for higher returns, which usually triggers an explosion of altcoin rallies.
Recommended Articles


