




Gold Price Forecast: Higher-Than-Expected CPI Weighs on Gold, Can PPI Push Gold Back to $4,200?
TradingKey - On Thursday (October 15), gold prices (XAUUSD) rebounded after a sharp drop on Wednesday. As of the European session on Thursday, gold prices bounced to around $4,160, touching an intraday high of $4,162, up about 1.3% for the day. Earlier, U.S. September CPI data exceeded market expectations, driving the U.S. dollar and Treasury yields higher, with gold prices falling to $4,073.41 at one point, a new one-week low. As the U.S. dollar pulled back from an 18-month high today, gold recovered some of its losses, but overall price action remains under pressure.
US CPI Heats Up More Than Expected; PPI Becomes Key to Gold Trends
According to data released by the U.S. Bureau of Labor Statistics on Wednesday, U.S. CPI rose 3.7% year-over-year in September, higher than the market expectation of 3.6% and up from 3.4% in August; on a month-over-month basis, it climbed 0.6%. Core CPI, which excludes food and energy prices, increased 2.6% year-over-year, also above the market expectation of 2.5%, and advanced 0.3% month-over-month.
Among components, gasoline prices rose 9.1% month-over-month in September, significantly accelerating headline inflation. Meanwhile, prices for housing, airfares, and certain goods continued to rise, indicating that inflationary pressures were not confined to the energy sector.
The higher-than-expected CPI data reignited market expectations for further rate hikes by the Federal Reserve. According to the CME FedWatch tool, the market priced in a roughly 32% probability of a 25-basis-point rate hike by the Fed in October, up from 22% prior to the CPI release. As a result, the U.S. Dollar Index rose noticeably on Wednesday, while U.S. Treasury yields also moved higher, raising the opportunity cost of holding gold and pushing gold prices down for a third consecutive trading session.
For investors, today's key focus will be the upcoming U.S. PPI release for September. The market currently expects headline U.S. PPI to rise 0.6% month-over-month in September, up from 0.4% in August, while core PPI is expected to increase 0.3% month-over-month. Since the PPI reflects producer-side price changes—with certain service-sector prices in particular influencing the Fed's closely watched PCE inflation gauge—the results could further shift market expectations regarding monetary policy.
If the PPI comes in higher than expected, particularly if core PPI gains accelerate, it could signal that upstream price pressures are still building, prompting the market to further raise Fed rate-hike expectations. In that scenario, the U.S. dollar and U.S. Treasury yields could resume their upward trend, while gold would face the risk of retesting $4,100.
Conversely, if the PPI comes in below expectations, especially with a modest reading in core PPI, it could alleviate some of the rate-hike pressures stemming from yesterday's hotter-than-expected CPI, allowing the U.S. dollar and Treasury yields to pull back and creating conditions for gold to rebound further.
Gold Price Technical Analysis
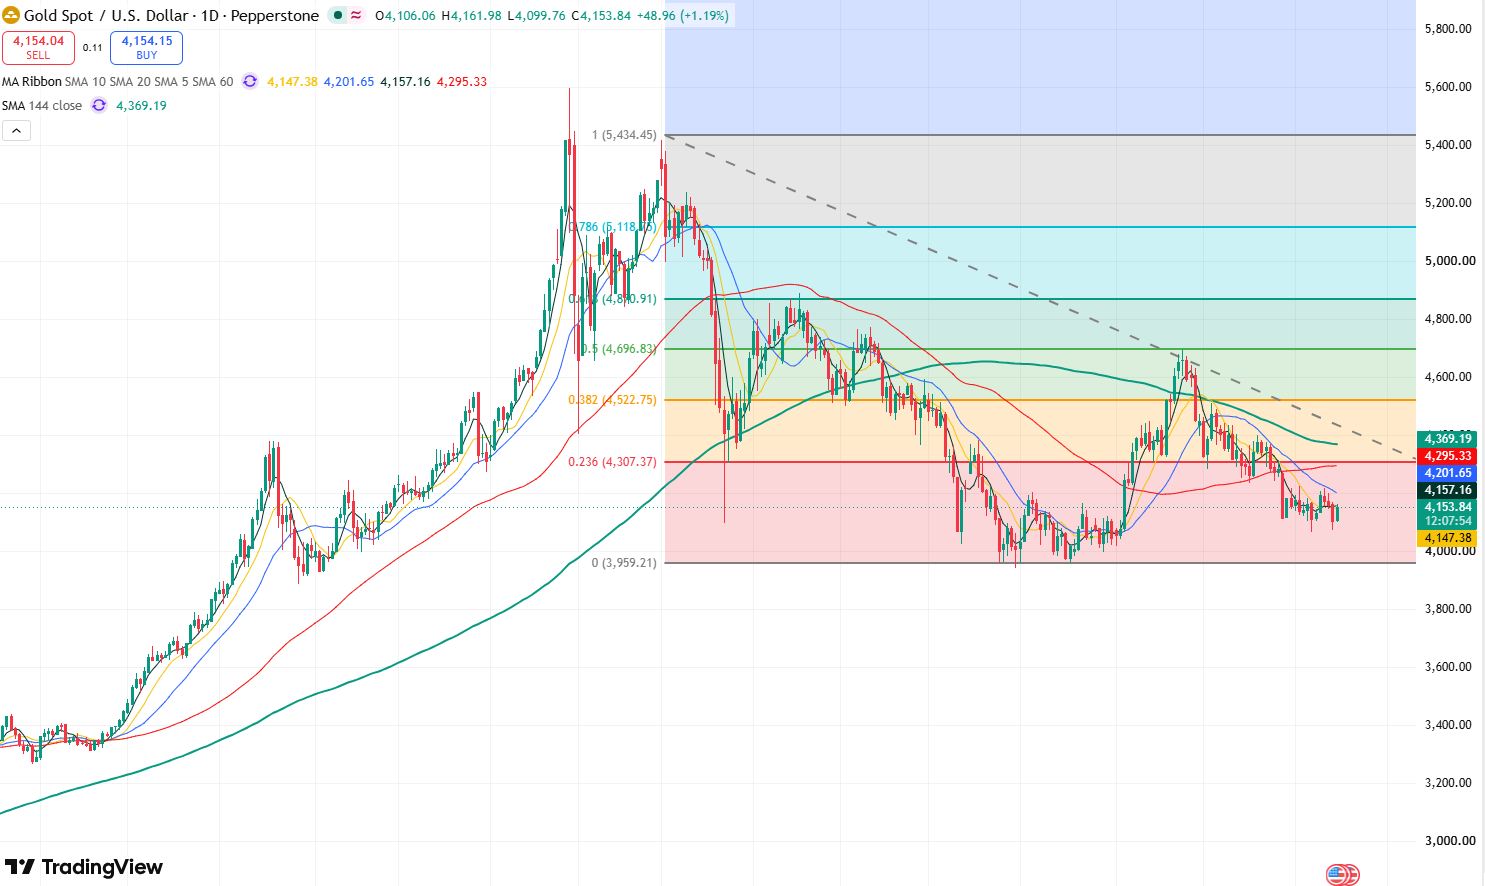
Gold price daily chart, Source: TradingView
From gold's daily chart, impacted by Wednesday's higher-than-expected CPI data, gold price fell below $4,100 intraday on Wednesday, hitting a low of $4,073.41, but did not fall below the October 7 low of $4,066.35, indicating strong support near this level. Meanwhile, Wednesday's closing price remained firmly above $4,100, showing that dip-buying near this level provides ongoing support for gold. On Thursday, gold rebounded back above $4,140, indicating that short-term selling pressure has eased.
Currently, the primary resistance level to watch on the upside is $4,160. If today's PPI release comes in lower than expected and pushes gold above this level, the next key resistance to watch is $4,200–$4,230. Only by firmly holding above $4,230 can the room for a short-term rebound be further expanded.
To the downside, the primary support level to watch is the $4,100 mark. If this level is broken, gold may continue to test the key support at $4,066. If this level fails to hold, gold could further test the round-number mark of $4,000.
Recommended Articles


