


Gold Is Falling—Should You Panic? First Look at This 175 year Indicator
If there were an indicator which, over the past 175 years, has signaled that “something big is about to happen” every time it breaks below a certain level—but this time it has fallen to an all‑time low while the economy still looks fine—how would you read that signal?
This indicator is called the “copper‑to‑gold ratio.”
It has recently dropped to its lowest point in 175 years, lower than during the 2008 financial crisis, and lower than during the 2020 Covid crash. According to more than a century of historical pattern, this should be an extremely scary recession signal: in most past cases, when the copper‑to‑gold ratio fell to extremely low levels, a major economic recession or a major surge in gold prices followed.
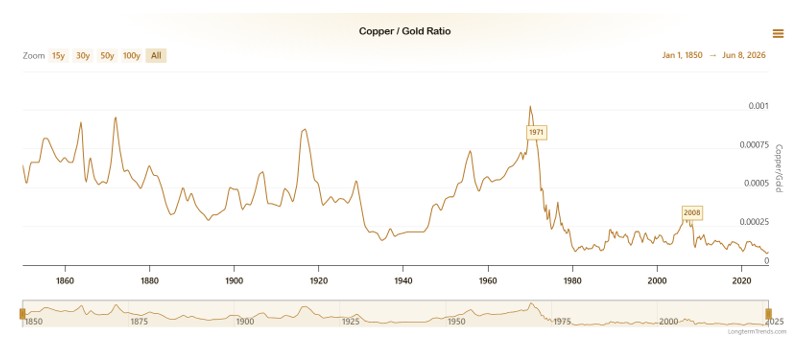
Source: LongtermTrends
The paradox is that US economic data are still showing expansion; the May jobs report beat expectations, and the stock market has only pulled back slightly from record highs.
So we have a 175‑year low in the ratio coexisting with an economy that appears “okay.”
What is even more puzzling is that the indicator’s most loyal disciple—Jeffrey Gundlach, founder of DoubleLine Capital, the “bond king” who manages over 100 billion dollars—said something in early 2025 that left many people scratching their heads:
“The copper‑to‑gold ratio has stopped working.”
A core indicator he had used for over a decade was declared invalid by its own creator.
So has the indicator truly stopped working? Or are we living through a historical window where old patterns are breaking down but new ones have yet to fully form?
This article is an attempt to unpack that.
Copper is the economy’s doctor, gold is the fear thermometer
To understand why this ratio is useful, you first need to know what copper and gold each “say.”
Copper’s logic is straightforward: it is about “use.” You need copper pipes to build houses, about 83 kilograms of copper to produce each electric vehicle (roughly four times that of a conventional gasoline car), and AI data centers rely on copper for server interconnects and power transmission. Copper is the basic conductor that keeps modern civilization running. Whenever industrial activity increases, demand for copper goes up; when the economy cools, factories cut production, construction slows, and copper demand is one of the first to feel it.
Because of this, economists gave copper the nickname “Dr. Copper”—the metal with a PhD in economics. Its price often reflects the direction of the economy earlier than GDP data and is widely recognized as a leading indicator.
Gold, on the other hand, has a completely different logic: it is about “distrust.”
Gold does not generate any income; if you lock it in a safe, it just sits there. Yet for five thousand years of human history, it has remained the ultimate form of wealth for one simple reason: it does not depend on anyone’s promise. Paper money requires trust in the government that issues it, bonds require trust in the borrower’s ability to repay, and bank deposits require trust in the bank. Gold requires none of that.
The more fearful people are, the less they trust, the more they sense that the world is about to run into big trouble, the more they want to hold onto gold. In essence, the gold price is a real‑time thermometer of distrust in the existing order.
Put these two logics into the same formula and you get the copper‑to‑gold ratio:
Copper‑to‑gold ratio = copper price ÷ gold price = optimism about the economy ÷ fear about the world
A high ratio means people are optimistic about the economy, willing to engage in industrial production, and that optimism dominates. A low ratio means people have lost faith in the economy, are flocking into gold, and fear dominates.
This logic is so simple that it makes you wonder whether it can really be useful—but it actually is, and surprisingly so.
Why can this ratio predict interest rates?
This is what fascinates institutional investors the most, yet is largely unknown to retail investors: the copper‑to‑gold ratio is not just a sentiment indicator; it has been a leading indicator for interest rates.
The chain of logic works like this:
When the copper‑to‑gold ratio rises (economic optimism), it means businesses are expanding and demand for funding is increasing. When the demand for capital rises, interest rates naturally move higher. The 10‑year US Treasury yield, the benchmark for long‑term global capital pricing, tends to follow this signal higher.
When the copper‑to‑gold ratio falls (fear dominates), it means economic expectations are cooling, financing demand is shrinking, and capital is flowing into safe assets. Interest rates move lower, and the 10‑year US Treasury yield also declines.
Academic papers and institutional research have found that the correlation between the copper‑to‑gold ratio and the 10‑year US Treasury yield was once as high as 0.85. From roughly 2000 to 2021, this was not “sometimes correlated,” it was highly correlated. But it is important to note that this correlation has weakened significantly after Covid; in recent years it has nearly vanished—this is the direct reason why Gundlach declared that it has stopped working.
In his late‑2019 call, Gundlach pointed out that the rebound in the copper‑to‑gold ratio implied that the 10‑year US Treasury yield should move up to around 2%, and yields did indeed drift up from about 1.8% at the time. Later, pushed by surging inflation and aggressive Fed rate hikes, the 10‑year yield climbed from about 1.5% in early 2022 all the way to around 4.25% in October 2022, and even briefly broke above 5% in October 2023, marking the fastest hiking cycle since the 1980s. During this phase, the copper‑to‑gold ratio generally moved in the same direction as yields, reflecting their linkage over the big cycle.
Extend this logic chain a bit further and you see where gold fits in:
Copper‑to‑gold ratio → direction of interest rates → gold’s position
When the copper‑to‑gold ratio falls and interest rates move down, a window of opportunity often opens for gold. Because lower rates reduce the opportunity cost of holding gold (the deposit interest you are giving up shrinks), capital is more willing to flow into non‑yielding gold.
This chain turns the copper‑to‑gold ratio from a tool for commodity traders into a leading signal for gold investors.
Three historical signals—what happened next?
Now that we have the theory, let’s test it against history by looking at three key points in time.
2007–2008: First alarm bell
From its 2006 high, the copper‑to‑gold ratio began to drift lower and continued to slide throughout 2007. Many people still felt the economy was fine at the time: house prices were rising and the stock market was near record highs. But the copper‑to‑gold ratio was quietly saying that fear was building and industrial demand was weakening.
In September 2008, Lehman Brothers collapsed. Copper prices then plunged, while gold, after about two to three months of liquidity‑driven selling, began a three‑year bull market, rising from a low around 730 dollars in October 2008 to about 1,920 dollars in August 2011—a gain of roughly 163%. The copper‑to‑gold ratio had already been flashing warning signals at least a year before the crisis erupted.
2019–2020: Covid crash warning
From the second half of 2019 into early 2020, the copper‑to‑gold ratio kept making new lows. The market was still talking about a “soft landing,” but the ratio was telling us fear was rising.
In March 2020, the Covid‑induced global market crash hit. Copper prices collapsed, and gold was briefly sold off along with everything else (typical of the early stage of any liquidity crisis), but then rebounded. The copper‑to‑gold ratio bottomed that March. The subsequent massive stimulus from governments worldwide drove a surge in copper demand, and the ratio rebounded sharply, perfectly marking the bottom of that crisis as well as signaling the subsequent rapid global recovery and rate rebound.
2023–2026: The strangest episode in history
From 2023 onward, the copper‑to‑gold ratio has been on a steady downward trend, hitting a 175‑year low in 2025, lower than in 2008 and lower than in 2020.
But economic data did not collapse. From 2023 to 2025, US equities repeatedly hit new all‑time highs, US employment data kept beating expectations, and GDP continued to grow. The AI investment boom made capital markets run hot.
The copper‑to‑gold ratio is screaming “extreme fear,” while reality says “the economy is okay.”
Within the framework of the modern globalized economy, this kind of divergence has never occurred before, and is at least the most extreme in the past half‑century. Gundlach’s remark that “the copper‑to‑gold ratio has stopped working” was precisely about this phenomenon.
The ratio is distorted—and the distortion itself is the key signal
Now we get to the core issue.
Copper‑to‑gold ratio = copper price ÷ gold price. If it has fallen to an all‑time low, there are only two possibilities:
A: Copper prices have fallen (industrial demand has collapsed, the economy is truly weak).
B: Gold prices have risen too fast (the denominator has swelled, making the ratio look extremely low).
This time it is B.
Copper has not fallen; it has risen. Copper prices gained close to 40% in 2025, and in June 2026, copper trades around 6.31 dollars per pound.
If you think carefully, copper’s fundamentals are not bad at all. Each electric vehicle uses about 83 kilograms of copper, four times that of a gasoline car. AI data centers demand several times more copper than traditional data centers; server interconnects, power delivery, and cooling systems are all huge copper consumers. In theory, these structural sources of demand should be pushing the copper‑to‑gold ratio upward.
Yet the ratio keeps falling.
An indicator based on collapsing industrial demand does not usually show up at a time when copper is up roughly 50%. The real cause lies on the other side: gold is the denominator that has run away. From early 2023 to the end of 2025, gold prices more than doubled; in 2025 alone, they rose about 64%, the strongest yearly gain in recent years. Systematic net buying by central banks worldwide, official holders—led by China—reducing their US Treasury holdings and simultaneously increasing gold reserves, and heightened risk aversion in the AI era have all contributed. These are institutional, structural forces, not short‑term retail‑driven panic in a normal economic cycle.
AI has injected a long‑term bullish driver into copper, but central banks, sovereign wealth funds, and institutional investors have injected an even stronger bullish driver into gold. In 2025, copper rose around 42%, while gold rose about 64%, meaning gold’s gain was roughly 1.5 times copper’s.
State Street captured this dynamic most clearly:
“This is not a story of aggregate demand collapse. Copper is rising; the economy is growing. What is undergoing structural repricing is gold itself—not because the economy is deteriorating, but because global trust in sovereign currencies and the debt system is being systematically re‑evaluated.”
The copper‑to‑gold ratio is a ruler that measures “economic optimism vs. economic fear.” But now, a large part of gold’s rise is measuring something else: the degree of trust in the existing monetary order. The ruler is not broken; it is just being used to measure a dimension that used to be invisible.
Here is a simple everyday analogy.
Suppose you normally measure inflation by how many apples a cup of coffee can buy. Under normal circumstances, this ratio reflects their relative market value. But if suddenly a group of large buyers systematically hoards apples—not because of natural disasters, but because they no longer trust the money in the bank—then the price of apples will be pushed to abnormally high levels. When one cup of coffee suddenly buys far fewer apples, the message is not that coffee has become worthless, but that apples have been assigned a new function: a money substitute.
Gold is now being assigned this function. The distortion in the copper‑to‑gold ratio is precisely a mirror of this transformation.
This dovetails perfectly with the broader story we have discussed before about “re‑marking America’s gold book” and “gold’s return to the monetary system.” The signal from the copper‑to‑gold ratio is not that the economy is about to collapse, but that we are entering an era in which the market is re‑pricing gold’s monetary attributes.
Gundlach says it has stopped working—what does he mean?
We need to be fair here, because ignoring this point would make the discussion incomplete.
When Gundlach said in early 2025 that the copper‑to‑gold ratio had stopped working, the gist of his full context was roughly as follows:
“The copper‑to‑gold ratio worked very well as a tool for predicting the 10‑year Treasury yield in the old low‑rate regime, but now that we are in a new environment of structurally higher inflation and higher long‑term rates, the old relationship has broken down.”
The “failure” he was referring to was very specific: using the copper‑to‑gold ratio to predict the direction of the 10‑year US Treasury yield.
And that use case has indeed cracked. The ratio has kept falling, while the 10‑year US yield has remained above 4% throughout 2025–2026, mostly trading in a 4.4%–4.6% band. The two lines have clearly diverged. Historically, a ratio this low would have implied yields crashing below 2%, but that obviously has not happened.
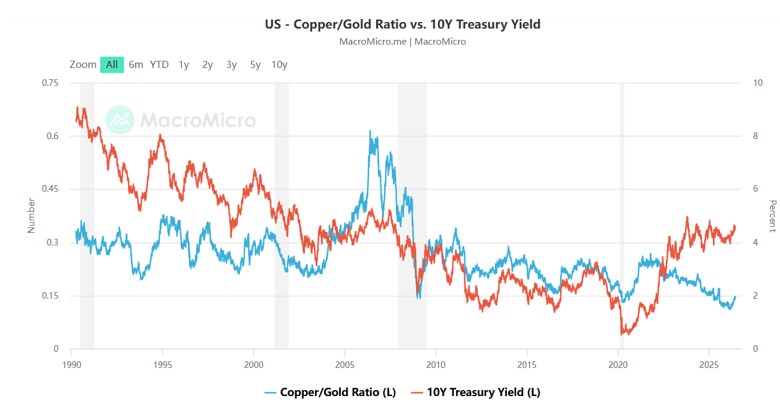
Source: MacroMicro
At the same time, Gundlach has said he now prefers to use oil prices and the US dollar index to judge the direction of interest rates.
However, his view on gold itself is a different story. In 2025 he publicly predicted that gold would rise to 4,000 dollars when it was about 2,900 at the time. Later, in an asset allocation framework published in early 2026, he suggested putting roughly 15% of a portfolio into real assets, explicitly flagging 10% for gold and 5% for a commodity basket. By May 2026, he had raised the recommended allocation to real assets back to around 20%. After gold briefly spiked to an all‑time high of about 5,595 dollars in January 2026, he said that any pullback to around 3,500 dollars would be a two‑handed buying opportunity.
So we need to separate two things clearly:
- The copper‑to‑gold ratio as a predictor of interest rates: In the new macro environment, this correlation has indeed weakened, and Gundlach himself no longer leans on it for rate calls.
- The copper‑to‑gold ratio as a thermometer for trust in the monetary system: This function has not only survived; it is more important than ever. The 175‑year low it is now showing does not mean the economy is about to collapse; it means trust in the monetary system has fallen to its lowest point in 175 years.
That is the truly insightful way to read it.
How should we use this indicator now? A three‑step framework
When looking at the copper‑to‑gold ratio, the key is not the absolute level of the number, but figuring out what is driving this particular move—copper or gold. Three steps are enough.
Step 1: Check whether copper is falling or gold is rising
When the ratio falls, first ask: is the numerator (copper) falling, or is the denominator (gold) rising?
If it is copper actively falling—factory orders are down, broad commodities are weak—then that is a genuine recession signal and a harbinger of lower interest rates, a double medium‑ to long‑term positive for gold.
If gold is rising while copper is also rising—as has been the case since 2023—then this is not a recession signal, but a signal that trust in the monetary system is being repriced. In this scenario, gold is rising because its monetary function is being re‑acknowledged by the market, and its link to the economic cycle has weakened.
Step 2: Read it together with the 10‑year US Treasury yield
Whether the copper‑to‑gold ratio and the 10‑year yield move together or diverge tells very different stories.
Copper‑to‑gold ratio | 10Y U.S. Treasury yield | What it usually signals for the cycle and for gold |
Falling | Also falling | Genuine recession/loosening signal; typically very supportive for gold (both growth expectations and real yields point the same way). |
Falling | Rising | Classic divergence: structural forces (inflation, deficits, central‑bank gold buying, etc.) are distorting the picture – this is roughly where we are now. |
Rising | Also rising | Economic expansion and tighter policy; higher real yields create short‑term headwinds for gold. |
Rising | Falling | Rare, regime‑shift type pattern; requires deeper macro and liquidity analysis before drawing conclusions. |
Right now: the copper‑to‑gold ratio is at low levels (driven by rising gold), while the 10‑year US yield is around 4.55%. This is a textbook divergence. It tells us that today’s gold rally has decoupled from the traditional “lower rates push gold up” logic and is being driven by a different force.
Step 3: Focus on trends, not absolute levels
The absolute value of the copper‑to‑gold ratio is not comparable across eras because both copper and gold prices evolve over time. What truly matters is the direction and duration of the trend.
Looking at data from the past few decades, when the ratio falls for more than about a year and the 10‑year yield also turns down, that combination often coincides with major turning points in the economic cycle. At present, the ratio has been sliding and hovering at low levels for nearly two years, while the 10‑year yield has stayed elevated. This kind of long‑lasting divergence is itself a signal that old rules are breaking down and new ones are forming—well worth watching.
What is the ratio saying at this moment?
Putting all the analysis together, the copper‑to‑gold ratio is currently saying a few things:
First (relatively certain): The monetary premium on gold is being rebuilt at a historically rare pace. Copper is rising, but gold is rising even more, which shows that capital is not only betting on industrial growth but also on the declining reliability of the traditional monetary reserve system. Today’s copper‑to‑gold ratio is an indicator of trust in money itself, not just a cyclical economic gauge.
Second (requires ongoing observation): If copper prices start to fall on their own—not because gold is even stronger, but because industrial demand truly weakens—then the ratio will enter a “second‑stage” decline. This time, it would be a genuine recession signal. If this coincides with a downward turn in the 10‑year yield, that would mean a recession plus a rate‑cutting cycle—a much stronger tailwind for gold.
Third (where retail investors most often err): Do not equate a low copper‑to‑gold ratio with “buy gold right now.” This indicator gives direction, not timing. It tells you that the macro environment is favorable for gold, but the questions of at what price to buy and what position size to take are separate issues entirely.
Gundlach’s public view in May 2026 was that gold would only be a two‑handed buying opportunity if it pulled back to around 3,500 dollars. Spot gold is currently around 4,300 dollars, an 18% gap. If a manager running tens of billions is willing to wait for a better entry point, retail investors have even less reason to chase in a burst of emotion.
In the end, the copper‑to‑gold ratio speaks to the same underlying issue
Fundamentally, the copper‑to‑gold ratio is a real‑time voting machine.
Those who believe in a better tomorrow put their money into factories, equipment, and the real economy; their choices get aggregated into the copper price.
Those who trust no promises and just want something that can hold value without relying on anyone else; their choices get aggregated into the gold price.
Every trading day at the open, the real decisions of millions of people are updated into this single ratio. It is faster than GDP reports, more honest than surveys, and more direct than expert interviews.
Right now it remains near the extreme lows since the mid‑19th century, close to the lowest range seen in 175 years.
You can read this in two ways. From a pessimistic angle, it reflects a real ebbing of confidence in the existing economic order—not that everything will collapse tomorrow, but that once such a trend takes hold, it does not reverse easily. From another angle, it signals a structural shift: gold’s role is changing. It is no longer a forgotten relic locked in central bank vaults; it is being brought back into the core of asset allocation by sovereigns, institutions, and a growing number of individuals.
These two interpretations are not contradictory. The flip side of ebbing confidence is the rise of alternatives.
The copper‑to‑gold ratio sitting at a 175‑year low is not shouting “buy gold now.” It is saying this: we are living through a window in which old rules have failed and new rules have not yet taken full shape. In such times, understanding what is really happening behind the numbers matters far more than guessing next month’s price.
Disclaimer: The content of this article is for investor education and reference only and does not constitute any investment advice. All data cited are from public sources; investing involves risks, and past performance does not guarantee future results.
Recommended Articles


