




EUR/USD Price Forecast: Bears eye break below 1.1000 with RSI near oversold territory
- EUR/USD remains under pressure near 1.1000 as hawkish Fed expectations support the US Dollar.
- The pair trades below its 50-, 100- and 200-day SMAs, keeping sellers in control.
- RSI near 30 and negative MACD readings reinforce the bearish momentum.
EUR/USD remains on the back foot on Monday and is on track for a fifth straight day of losses as a hawkish Federal Reserve (Fed) outlook keeps the US Dollar (USD) firmly bid. At the time of writing, the pair hovers just above the psychological 1.1000 level, near its lowest since April 2025.
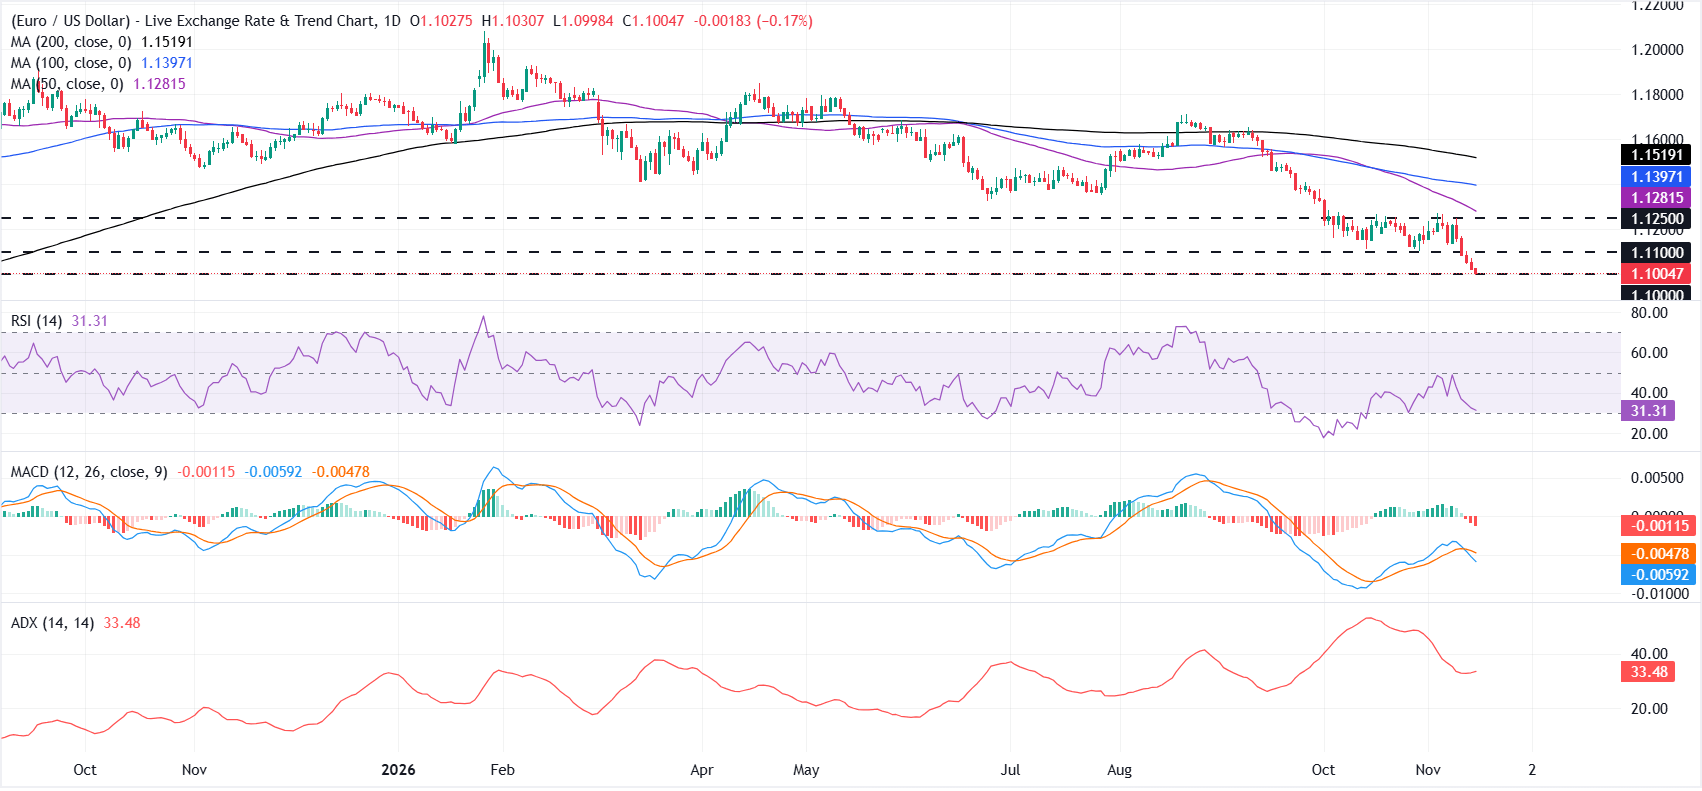
On the daily chart, EUR/USD extends its decline after breaking below a consolidation range in place since early October. The pair remains well below its 50-, 100- and 200-day Simple Moving Averages (SMAs), reinforcing the bearish bias.
The Relative Strength Index (RSI) at 31 hovers just above oversold territory, while the Moving Average Convergence Divergence (MACD) in negative territory hints at persistent downside pressure, reinforced by a still-elevated Average Directional Index (ADX) around 33, indicating a waning yet present trend strength.
On the topside, initial resistance appears at the horizontal barrier near 1.1100, ahead of 1.1250 and the 50-day SMA at 1.1281, with the 100-day SMA at 1.1397 and the 200-day SMA near 1.1519 marking a broader cap. On the downside, a decisive break below 1.1000 would expose the next psychological support at 1.0900.
(The technical analysis of this story was written with the help of an AI tool. Know more.)
Euro Price This Month
The table below shows the percentage change of Euro (EUR) against listed major currencies this month. Euro was the weakest against the US Dollar.
| USD | EUR | GBP | JPY | CAD | AUD | NZD | CHF | |
|---|---|---|---|---|---|---|---|---|
| USD | 1.55% | 1.40% | 1.16% | 2.20% | 4.26% | 2.31% | 1.82% | |
| EUR | -1.55% | -0.17% | -0.46% | 0.55% | 2.55% | 0.72% | 0.23% | |
| GBP | -1.40% | 0.17% | -0.25% | 0.77% | 2.75% | 0.87% | 0.42% | |
| JPY | -1.16% | 0.46% | 0.25% | 1.04% | 3.04% | 1.17% | 0.70% | |
| CAD | -2.20% | -0.55% | -0.77% | -1.04% | 2.03% | 0.11% | -0.38% | |
| AUD | -4.26% | -2.55% | -2.75% | -3.04% | -2.03% | -1.87% | -2.24% | |
| NZD | -2.31% | -0.72% | -0.87% | -1.17% | -0.11% | 1.87% | -0.46% | |
| CHF | -1.82% | -0.23% | -0.42% | -0.70% | 0.38% | 2.24% | 0.46% |
The heat map shows percentage changes of major currencies against each other. The base currency is picked from the left column, while the quote currency is picked from the top row. For example, if you pick the Euro from the left column and move along the horizontal line to the US Dollar, the percentage change displayed in the box will represent EUR (base)/USD (quote).
Recommended Articles


