




GBP/JPY Price Forecast: Sellers eye 214.00 after SMA break
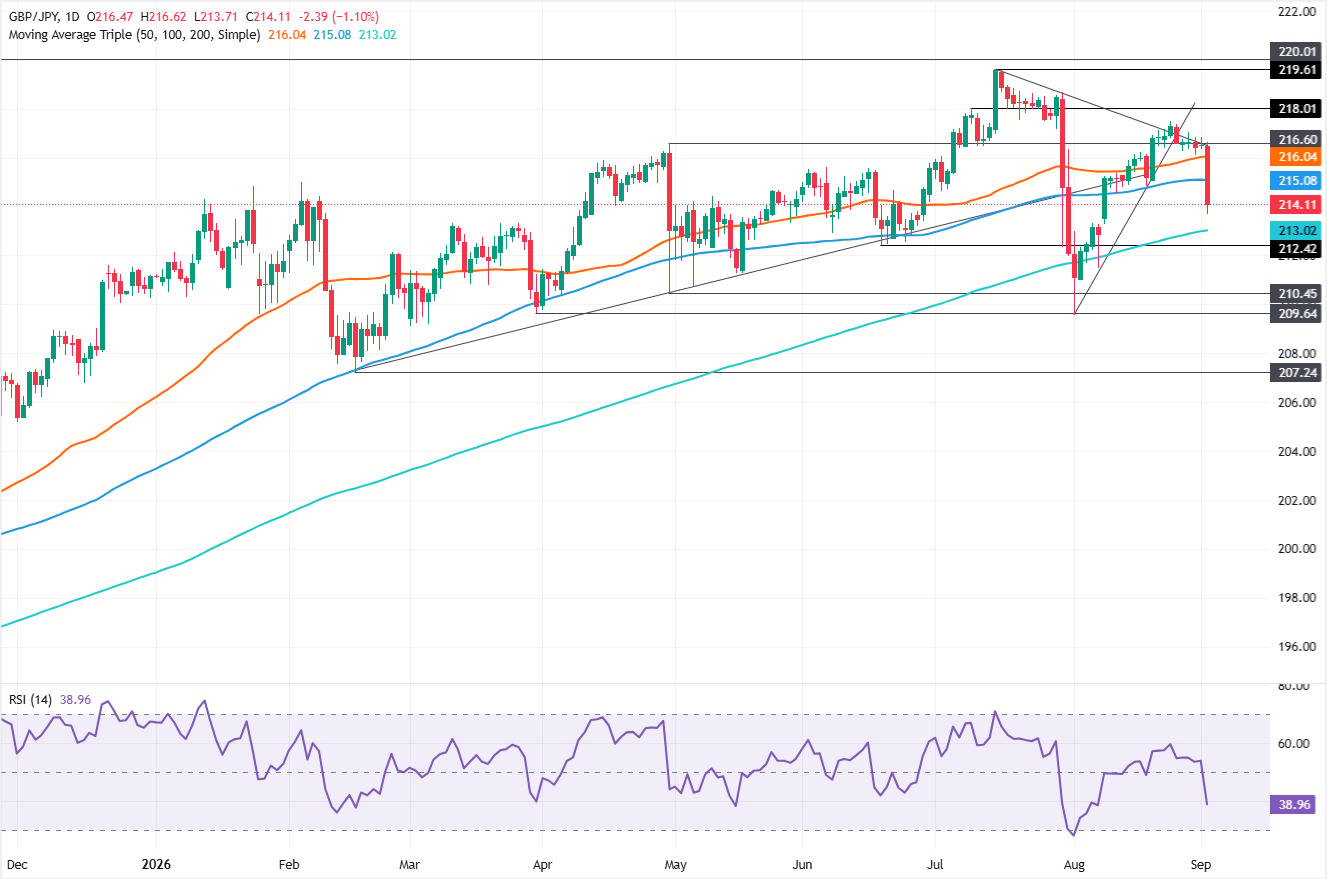
- GBP/JPY drops over 1%, breaking below the 100-day SMA.
- Bearish RSI signals sellers regain control of near-term momentum.
- Break below 214.00 exposes 213.02 and 209.58 supports.
The Pound Sterling collapses versus the Japanese Yen as growing “speculation” of an intervention in the FX markets witnessed the Yen appreciating versus most G8 FX currencies. The GBP/JPY trades with losses of more than 1.10%, at 214.08.
GBP/JPY Price Forecast: Technical Outlook
The cross-pair dipped below the 100-day Simple Moving Average (SMA) at 215.08, opening the door to further downside and putting the 214.00 milestone in play. Momentum shifted strongly bearish, as indicated by the Relative Strength Index (RSI). Hence, the path of least resistance is tilted to the downside, with sellers regaining control.
The GBP/JPY first support is 214.00. A breach of the latter will expose the 200-day SMA as the next support at 213.02. On further weakness, the August 3 cycle low of 209.58 would be the next area of interest, before sellers test yearly lows near 207.24.
On the other hand, if buyers drive the GBP/JPY exchange rate above the 100-day SMA, this could trigger some consolidation between the 215.08-216.04 area, with the latter being the 50-day SMA.
GBP/JPY Price Chart – Daily
Japanese Yen Price Today
The table below shows the percentage change of Japanese Yen (JPY) against listed major currencies today. Japanese Yen was the strongest against the New Zealand Dollar.
| USD | EUR | GBP | JPY | CAD | AUD | NZD | CHF | |
|---|---|---|---|---|---|---|---|---|
| USD | 0.05% | 0.24% | -0.87% | -0.37% | -0.32% | 0.74% | 0.16% | |
| EUR | -0.05% | 0.18% | -0.92% | -0.43% | -0.37% | 0.66% | 0.11% | |
| GBP | -0.24% | -0.18% | -1.09% | -0.59% | -0.56% | 0.46% | -0.08% | |
| JPY | 0.87% | 0.92% | 1.09% | 0.48% | 0.55% | 1.58% | 1.03% | |
| CAD | 0.37% | 0.43% | 0.59% | -0.48% | 0.06% | 1.09% | 0.55% | |
| AUD | 0.32% | 0.37% | 0.56% | -0.55% | -0.06% | 1.03% | 0.50% | |
| NZD | -0.74% | -0.66% | -0.46% | -1.58% | -1.09% | -1.03% | -0.53% | |
| CHF | -0.16% | -0.11% | 0.08% | -1.03% | -0.55% | -0.50% | 0.53% |
The heat map shows percentage changes of major currencies against each other. The base currency is picked from the left column, while the quote currency is picked from the top row. For example, if you pick the Japanese Yen from the left column and move along the horizontal line to the US Dollar, the percentage change displayed in the box will represent JPY (base)/USD (quote).
Recommended Articles


