


GBP/USD Price Forecast: Needs to stabilize above 1.3600 for fresh rally
- GBP/USD rises to near 1.3590 as the risk-on rally revives.
- US President Trump confirms that the ceasefire with Iran is intact.
- The US NFP is estimated to come in at 62K, lower than the previous reading of 178K.
The GBP/USD pair trades 0.25% higher to near 1.3590 during the European trading session on Friday. The Cable reflects strength as the Pound Sterling (GBP) outperforms its major currency peers, except antipodeans, amid a revived risk-on rally.
As of writing, S&P 500 futures are 0.3% higher to near 7,360, exhibiting firm demand for riskier assets. The US Dollar Index (DXY), which tracks the Greenback’s value against six major currencies, trades 0.16% lower to near 98.10. The DXY falls back after a recovery move on Thursday.
The appeal of risk-sensitive assets has revived as United States (US) President Donald Trump has confirmed that the ceasefire with Iran is intact despite the exchange of attacks near the Strait of Hormuz.
Meanwhile, investors await the US Nonfarm Payrolls (NFP) data for April, which will be published at 12:30 GMT. Investors will closely monitor the US NFP data to get fresh cues on the Federal Reserve’s (Fed) monetary policy outlook.
The labor market report is expected to show that the economy created 62K fresh jobs, significantly lower than 178K in March.
GBP/USD technical analysis
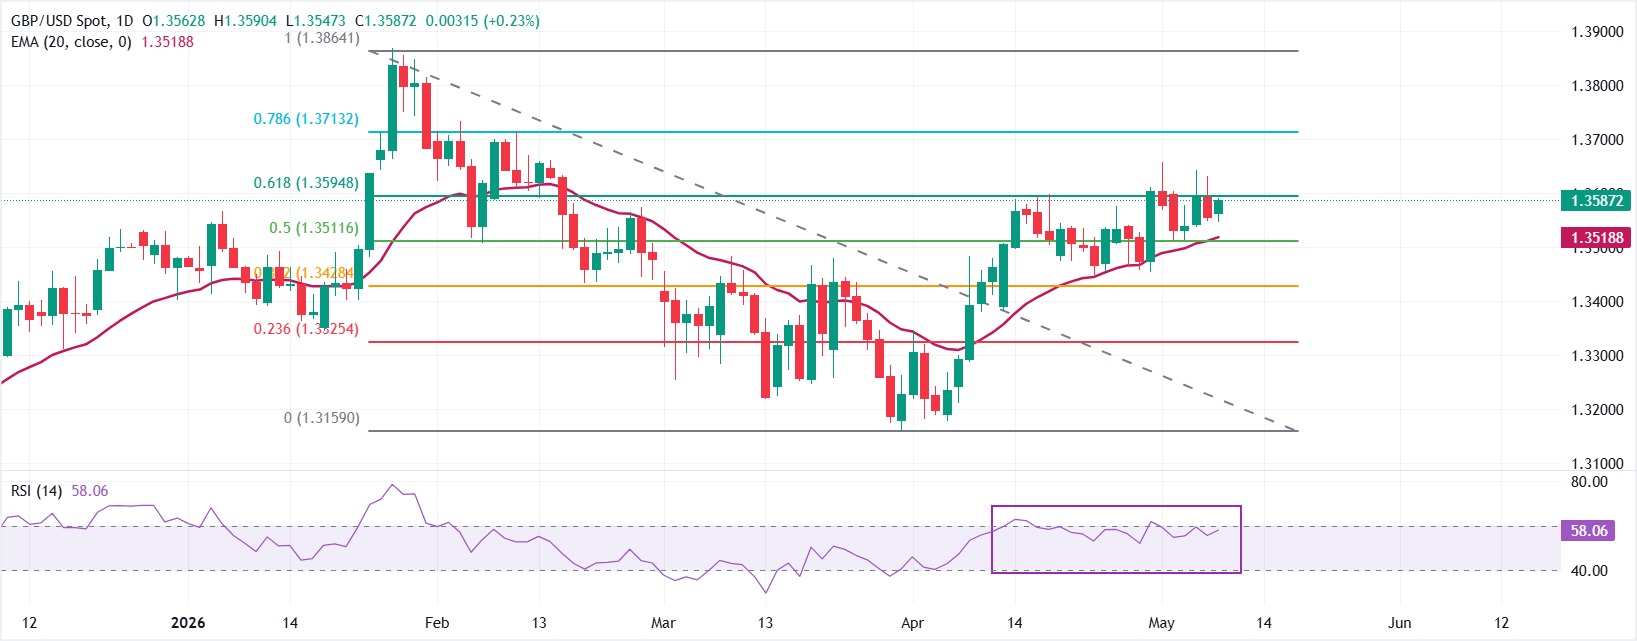
GBP/USD trades higher at around 1.3590 at the press time. The pair holds a constructive bullish tone as it remains above the 20-day exponential moving average (EMA) at 1.3519 and the 50.0% Fibonacci retracement at 1.3512. The pair is edging into a key retracement band, with the 61.8% Fibonacci level at 1.3595 acting as immediate overhead resistance, while a mid-range Relative Strength Index (RSI) near 58 hints at firm but not overstretched upside momentum.
On the topside, a clear break above the 61.8% retracement at 1.3595 would open the door toward the 78.6% Fibonacci barrier at 1.3713, ahead of the recent cycle high at 1.3864. On the downside, initial support is seen at the 20-day EMA at 1.3519, reinforced by the 50.0% retracement at 1.3512; a deeper pullback could then expose the 38.2% level at 1.3428, and the 23.6% retracement at 1.3325 before the broader bullish structure is challenged closer to the swing low at 1.3159.
(The technical analysis of this story was written with the help of an AI tool.)
Economic Indicator
Nonfarm Payrolls
The Nonfarm Payrolls release presents the number of new jobs created in the US during the previous month in all non-agricultural businesses; it is released by the US Bureau of Labor Statistics (BLS). The monthly changes in payrolls can be extremely volatile. The number is also subject to strong reviews, which can also trigger volatility in the Forex board. Generally speaking, a high reading is seen as bullish for the US Dollar (USD), while a low reading is seen as bearish, although previous months' reviews and the Unemployment Rate are as relevant as the headline figure. The market's reaction, therefore, depends on how the market assesses all the data contained in the BLS report as a whole.
Read more.Next release: Fri May 08, 2026 12:30
Frequency: Monthly
Consensus: 62K
Previous: 178K
Source: US Bureau of Labor Statistics
America’s monthly jobs report is considered the most important economic indicator for forex traders. Released on the first Friday following the reported month, the change in the number of positions is closely correlated with the overall performance of the economy and is monitored by policymakers. Full employment is one of the Federal Reserve’s mandates and it considers developments in the labor market when setting its policies, thus impacting currencies. Despite several leading indicators shaping estimates, Nonfarm Payrolls tend to surprise markets and trigger substantial volatility. Actual figures beating the consensus tend to be USD bullish.
Recommended Articles


