


Ethereum Price’s Climb Above $2,500 Requires Crossing This “Red Circle”


Ethereum (ETH) is trading at $2,187, recovering inside a rising channel after pulling back from a March high near $2,393. Two on-chain signals and a clear technical resistance zone now frame exactly what bulls need to clear for a run toward $2,500.
The exchange outflow picture is constructive. However, one valuation metric is flashing caution at the same time, and the chart has a specific price zone that has already rejected ETH once.
Record Ethereum Exchange Outflows Signal Accumulation
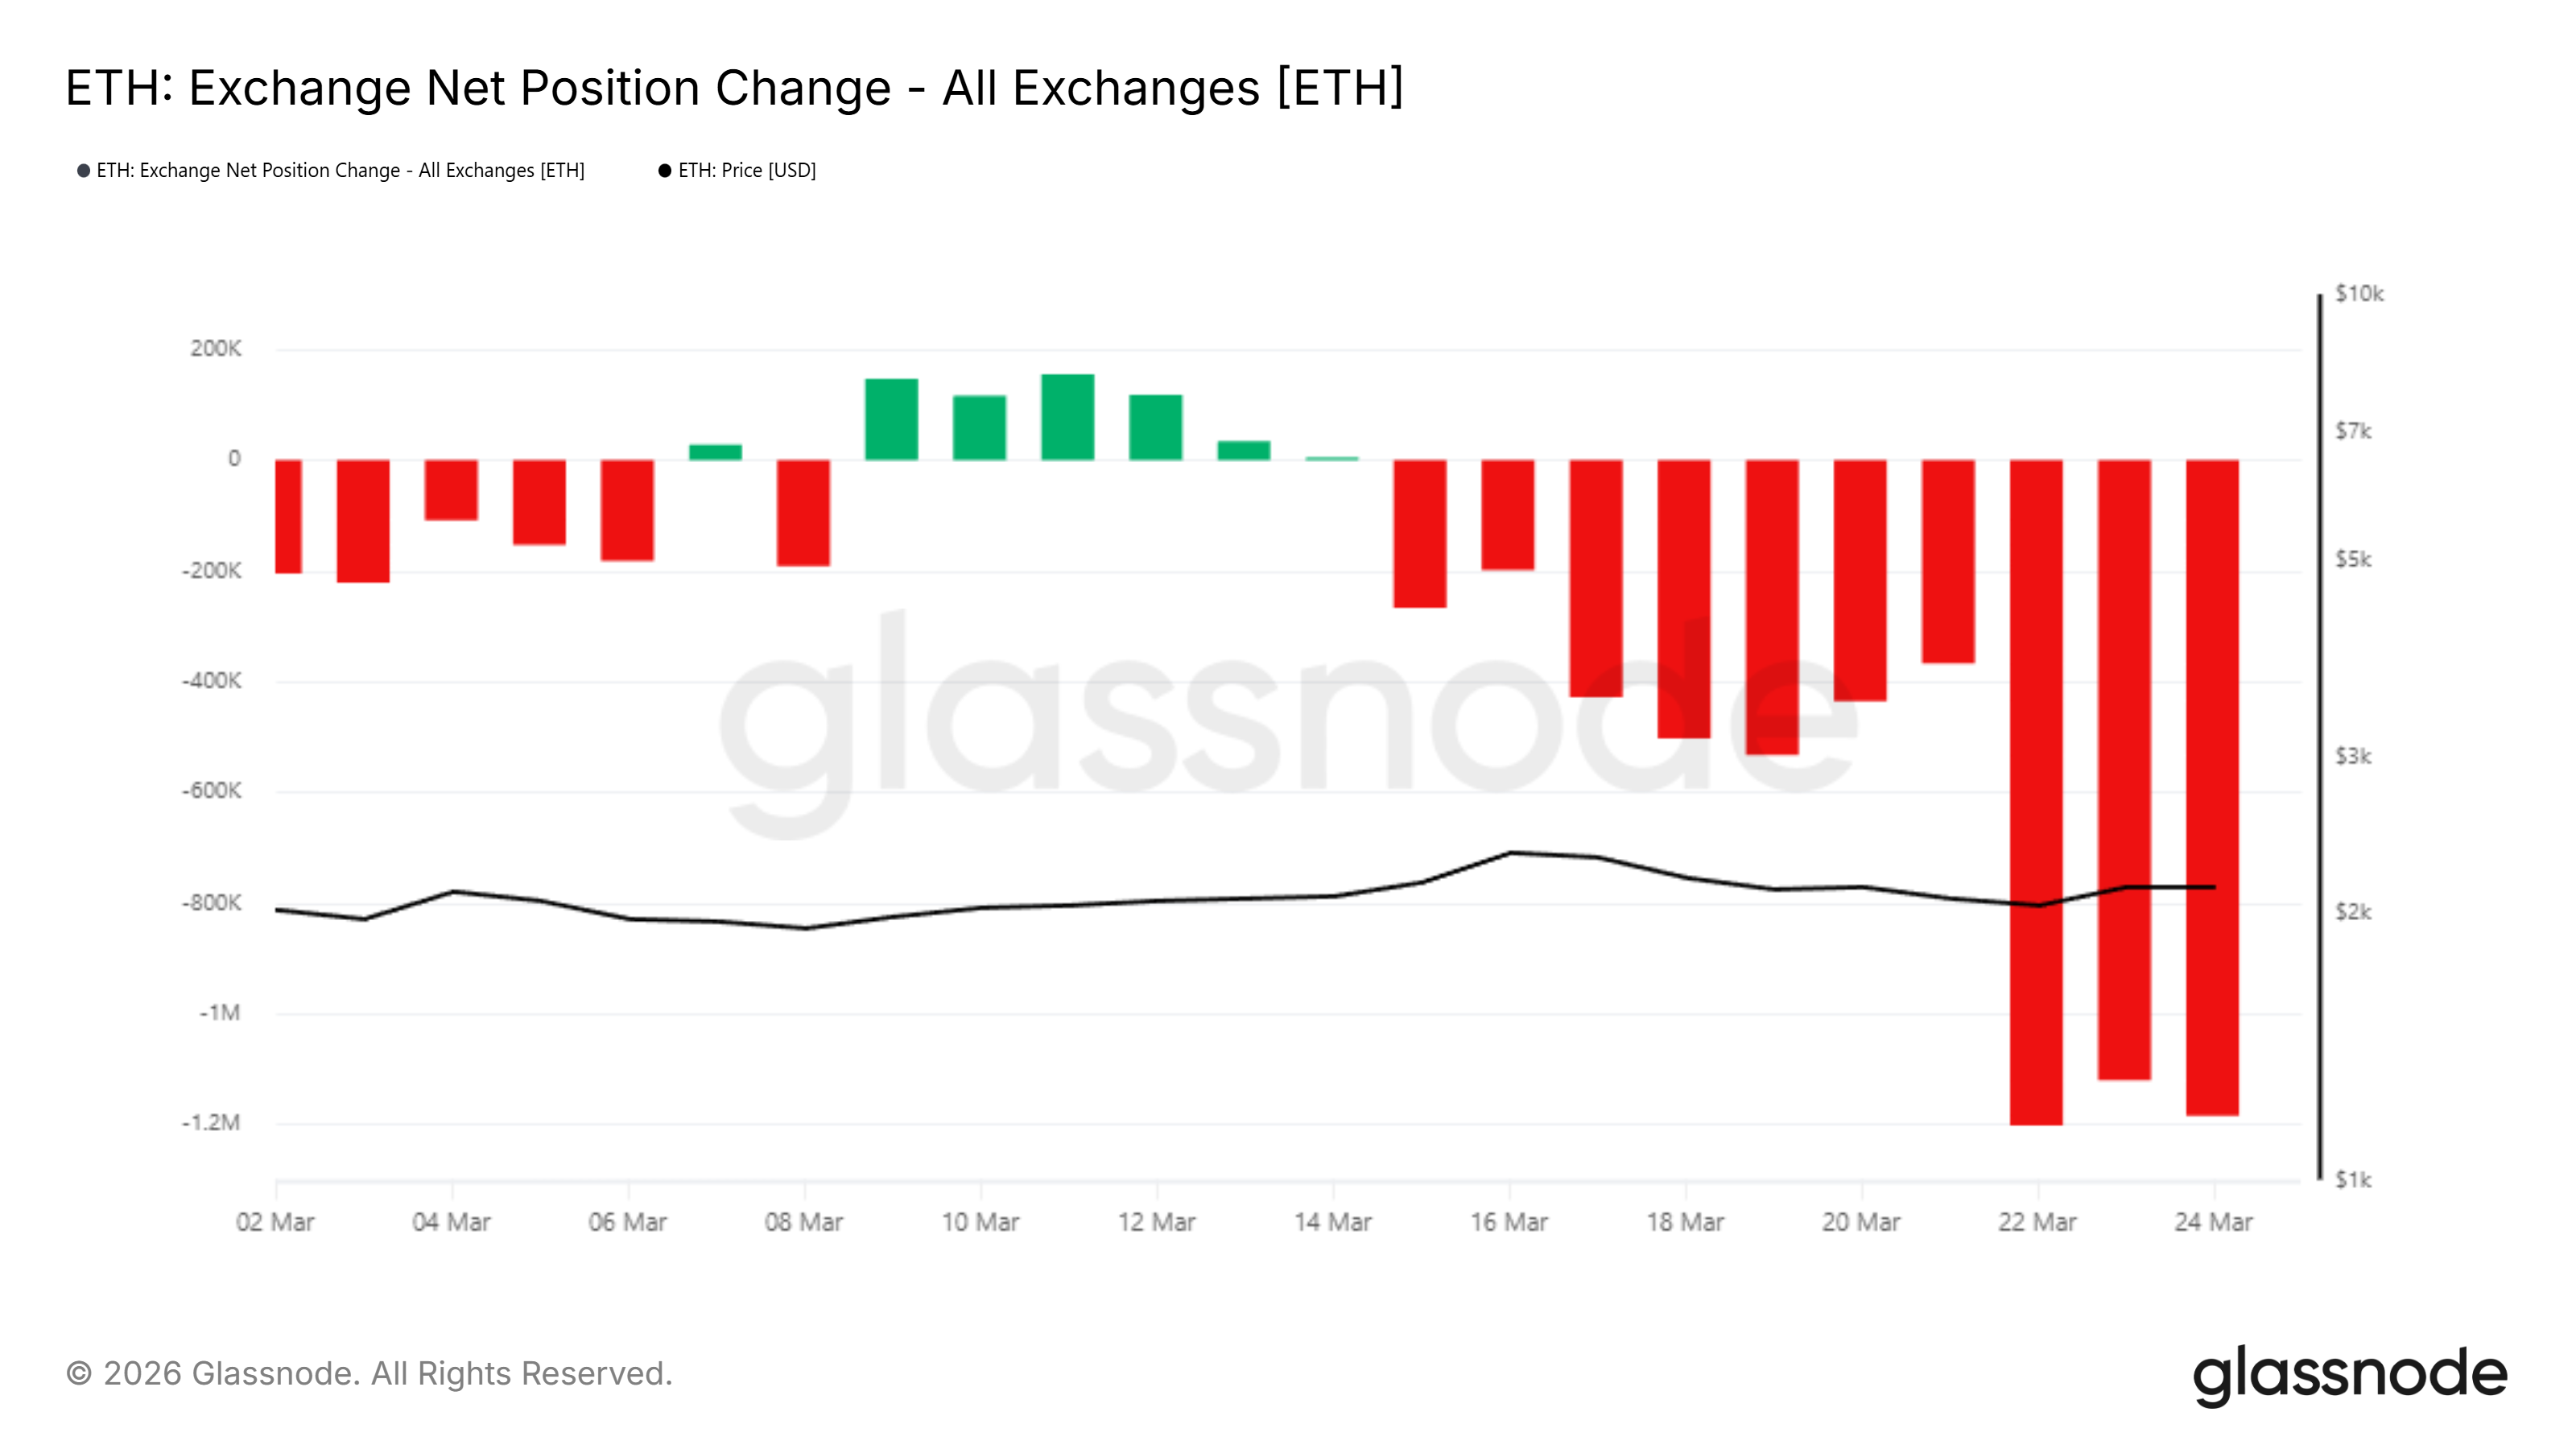
The Glassnode exchange net position change chart covers ETH across all exchanges from March 2 through March 25. The first half of March was mixed — small red bars through early March gave way to green bars between March 8 and March 13, meaning ETH was flowing into exchanges during that stretch, a typical sign of sell preparation.
From March 14 onward, the picture shifted sharply. Red bars, representing net ETH leaving exchanges, returned and grew in magnitude through the final week of March.
The largest outflow bars visible on the chart land around March 22 and March 24–25, reaching depths approaching -1.2 million ETH on a single day. ETH leaving exchanges at scale generally means holders are ideally buying the low prices, reducing immediate sell-side supply.
Want more token insights like this? Sign up for Editor Harsh Notariya’s Daily Crypto Newsletter here.
However, the sheer size of recent outflows also reflects the elevated price sensitivity of the market at this level. Large movements in either direction tend to precede sharp price swings.
Is ETH Entering the Overvalued Phase?
The Network Value to Transactions (NVT) Signal chart spans February 19 through March 25, 2026. It measures ETH’s market cap relative to on-chain transaction volume, essentially a price-to-earnings ratio for the network. When NVT rises, the price is growing faster than the economic activity supporting it.
The reading sat near 48 in mid-February. It climbed through March, peaked near 64 around March 17, pulled back briefly, and has since recovered to approximately 60 as of March 25. Ethereum’s price, shown by the black line, has remained relatively flat in the $2,100–$2,300 range throughout this period.
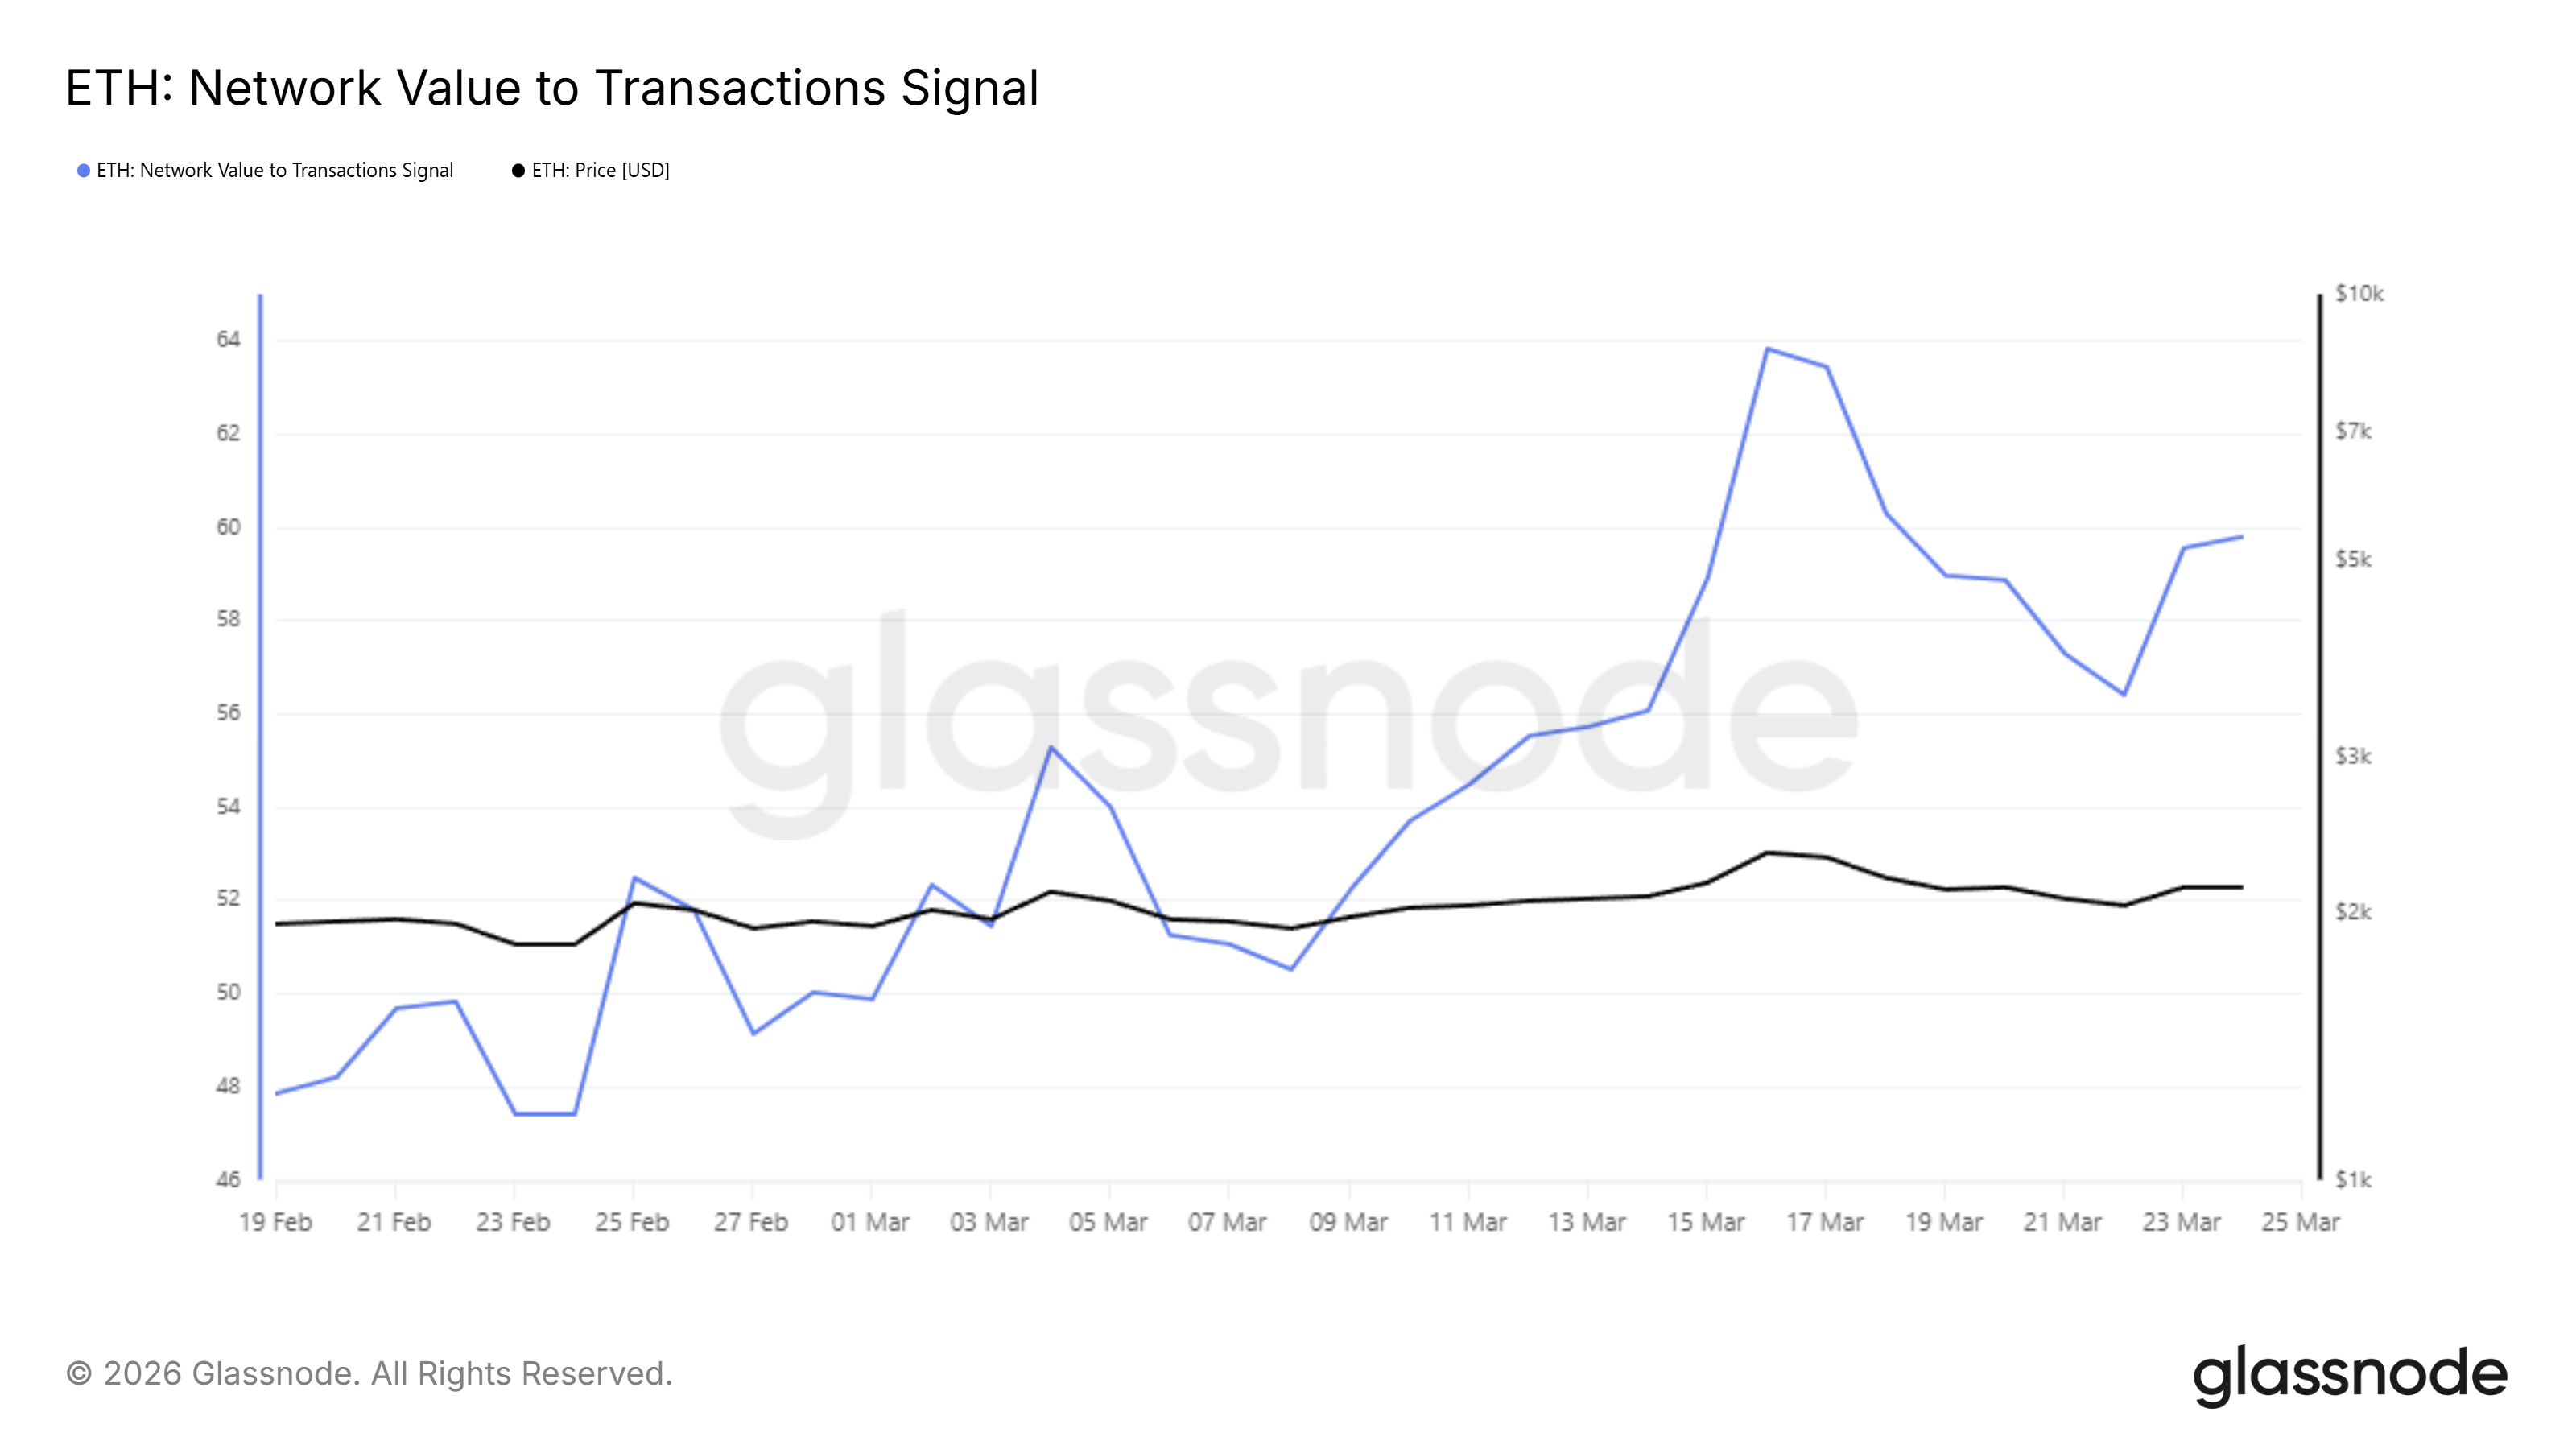
The divergence is the concern. On-chain transaction volume has not grown proportionally with the market cap expansion. A rising NVT Signal does not guarantee a price drop. However, it does mean that the current valuation needs stronger network activity to stay justified. If transaction volume does not catch up, ETH becomes increasingly expensive relative to its fundamental usage.
ETH Price Has a Clear Target
Ethereum’s price is trading at $2,186, sitting between the 23.6% Fibonacci level at $2,130 and the 38.2% level at $2,203. The Fibonacci grid is drawn from the cycle low at $2,023 up to the recent swing high at $2,494. The 20-day EMA sits at $2,145, just below the price and rising, a near-term supportive signal.
ETH is trading inside a well-defined rising wedge, with the lower boundary currently near $2,080. The channel structure has been intact since the February 25 low, and the price has respected both boundaries across multiple tests.
The annotated “red circle” on the chart sits at the 78.6% Fibonacci retracement level at $2,393. This zone represents the prior rejection point from mid-March. Here, the Ethereum price reached a high near $2,393 before pulling back sharply toward $2,130. For bulls, this is the only meaningful resistance zone between the current price and the $2,500 target.
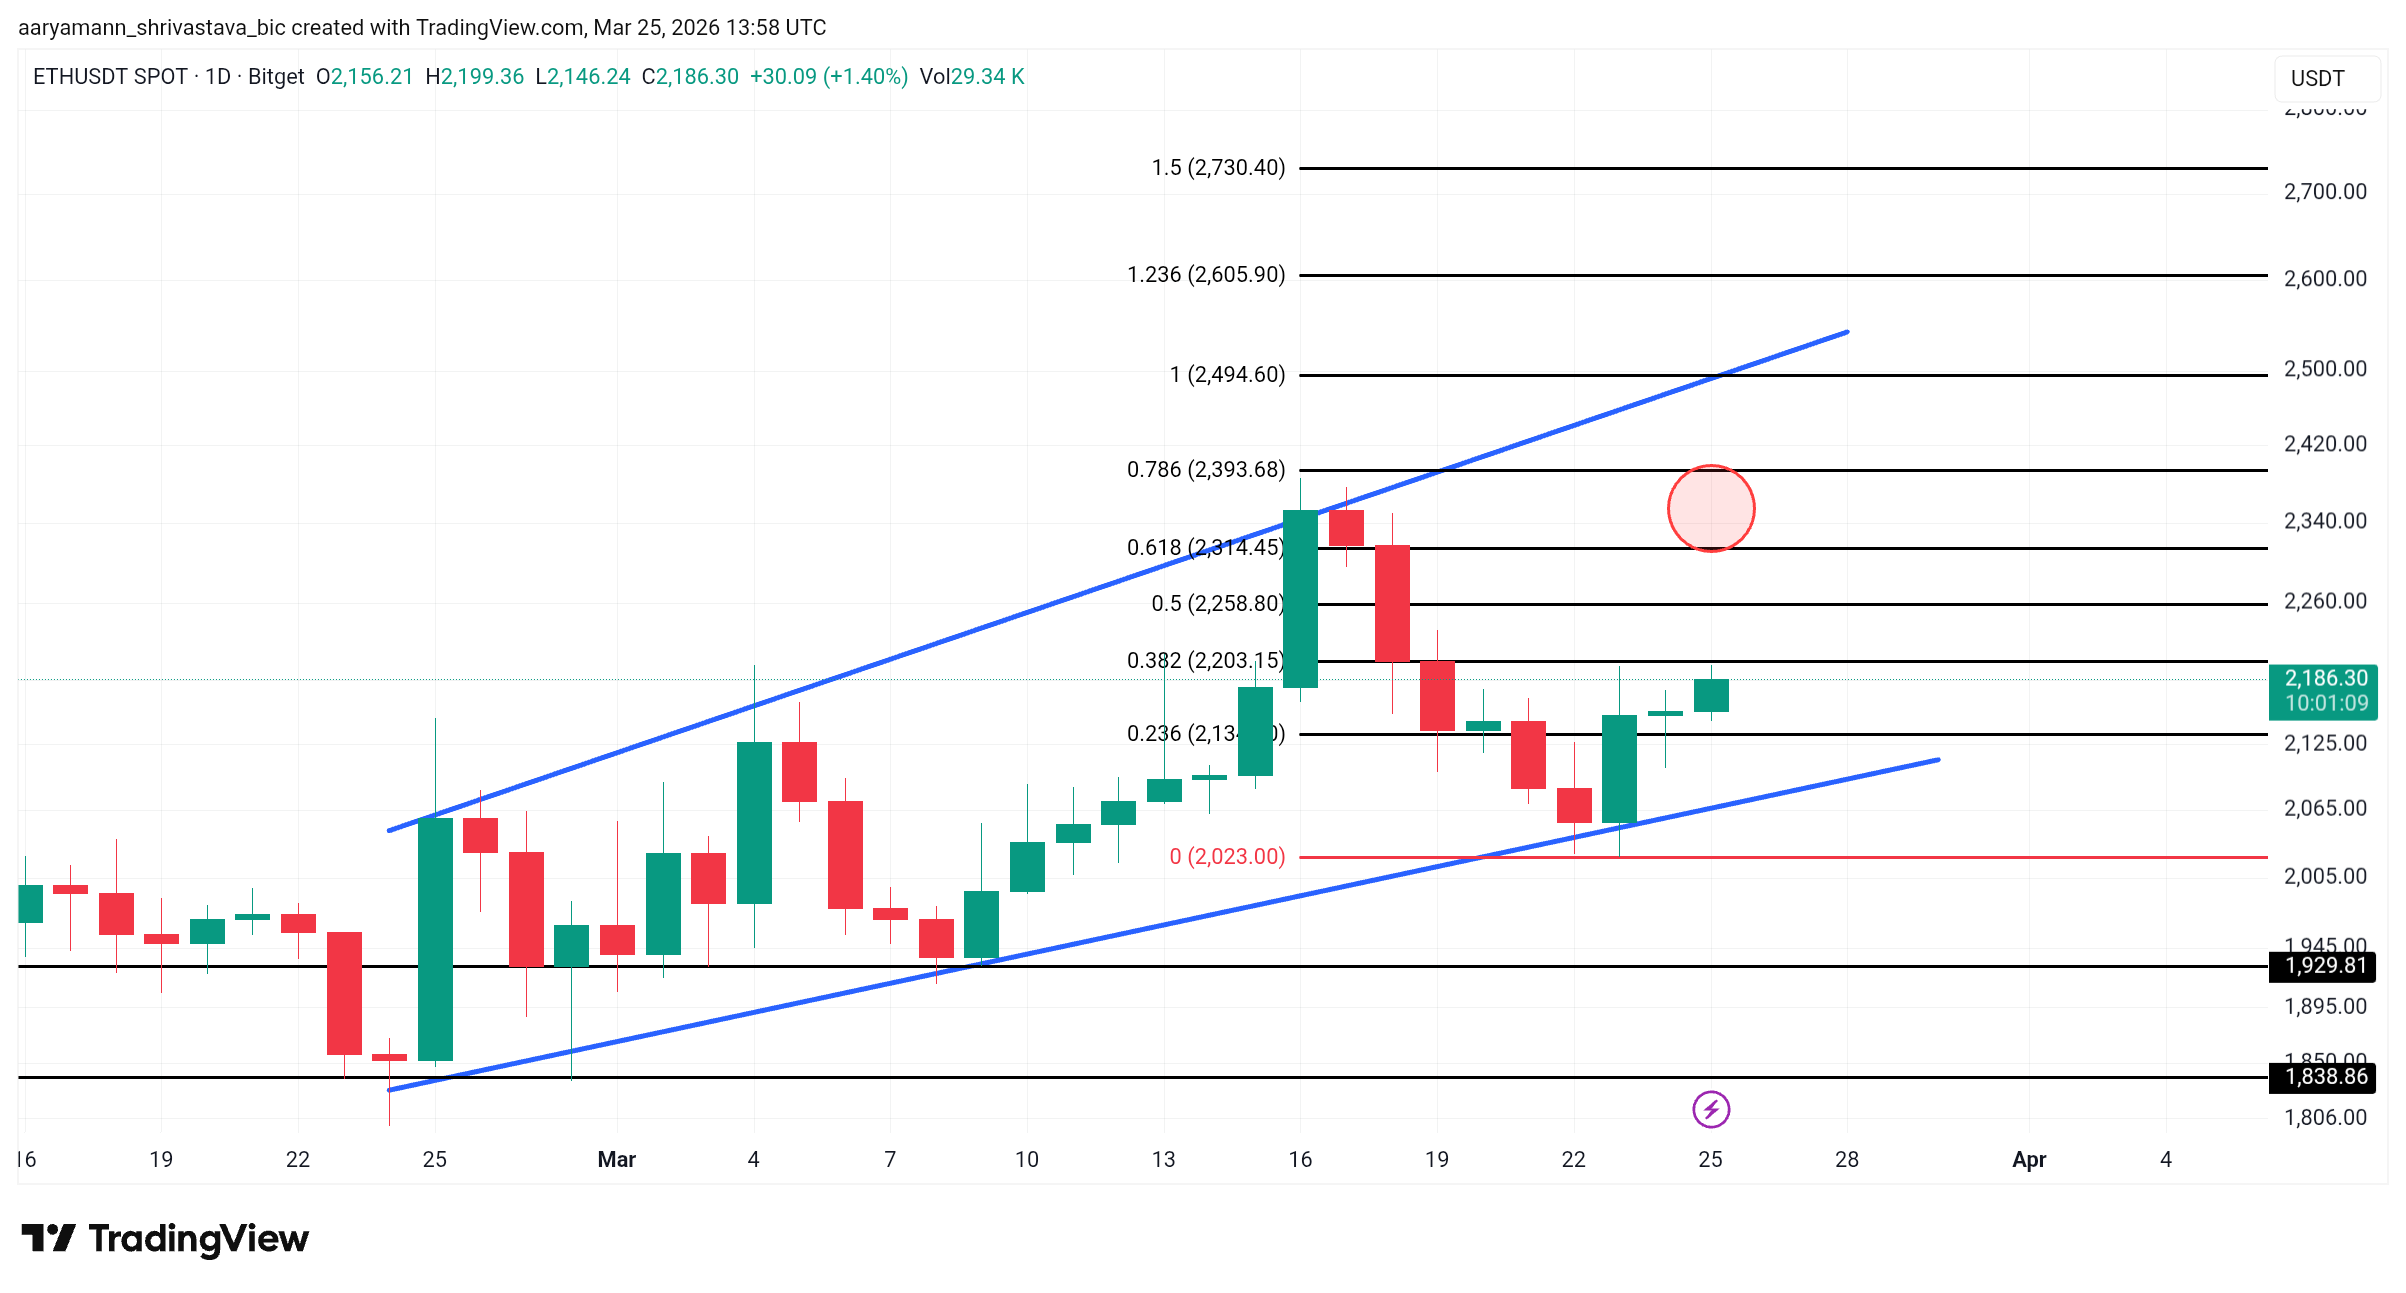
A 12-hour close above $2,393 opens the door to $2,494, followed by the 1.236 extension at $2,605. Following that comes the 1.5 extension at $2,730. Those levels align with the upper boundary of the rising channel. Once the 0.618 or 0.786 Fib is flipped into support, the price can bounce back and escape the pattern.
The invalidating scenario for the bullish thesis is a daily close below the rising channel’s lower boundary near $2,023. A loss of that floor would erase the entire structure built since late February. This would put $1,838 or $1,929 in focus as the next support.
* The content presented above, whether from a third party or not, is considered as general advice only. This article should not be construed as containing investment advice, investment recommendations, an offer of or solicitation for any transactions in financial instruments.


