


Ethereum Price Bounce Has Bulls Rushing In: Are They Overlooking a 17% Warning?


Ethereum (ETH) price trades near $2,130, up 3.6% today and 8.2% over the past month. The intraday bounce has drawn in whales and heavy long positioning. Yet the 8-hour chart is quietly building a pattern that could erase those gains and more.
The disconnect between on-chain optimism and technical risk is the story here. Ethereum whales and leveraged traders see upside. The chart structure sees a potential 17% drop. One side will be proven wrong, and the EMA cluster sitting right at the current price will likely decide which.
Whales and Derivatives Positioning Lean Heavily Bullish
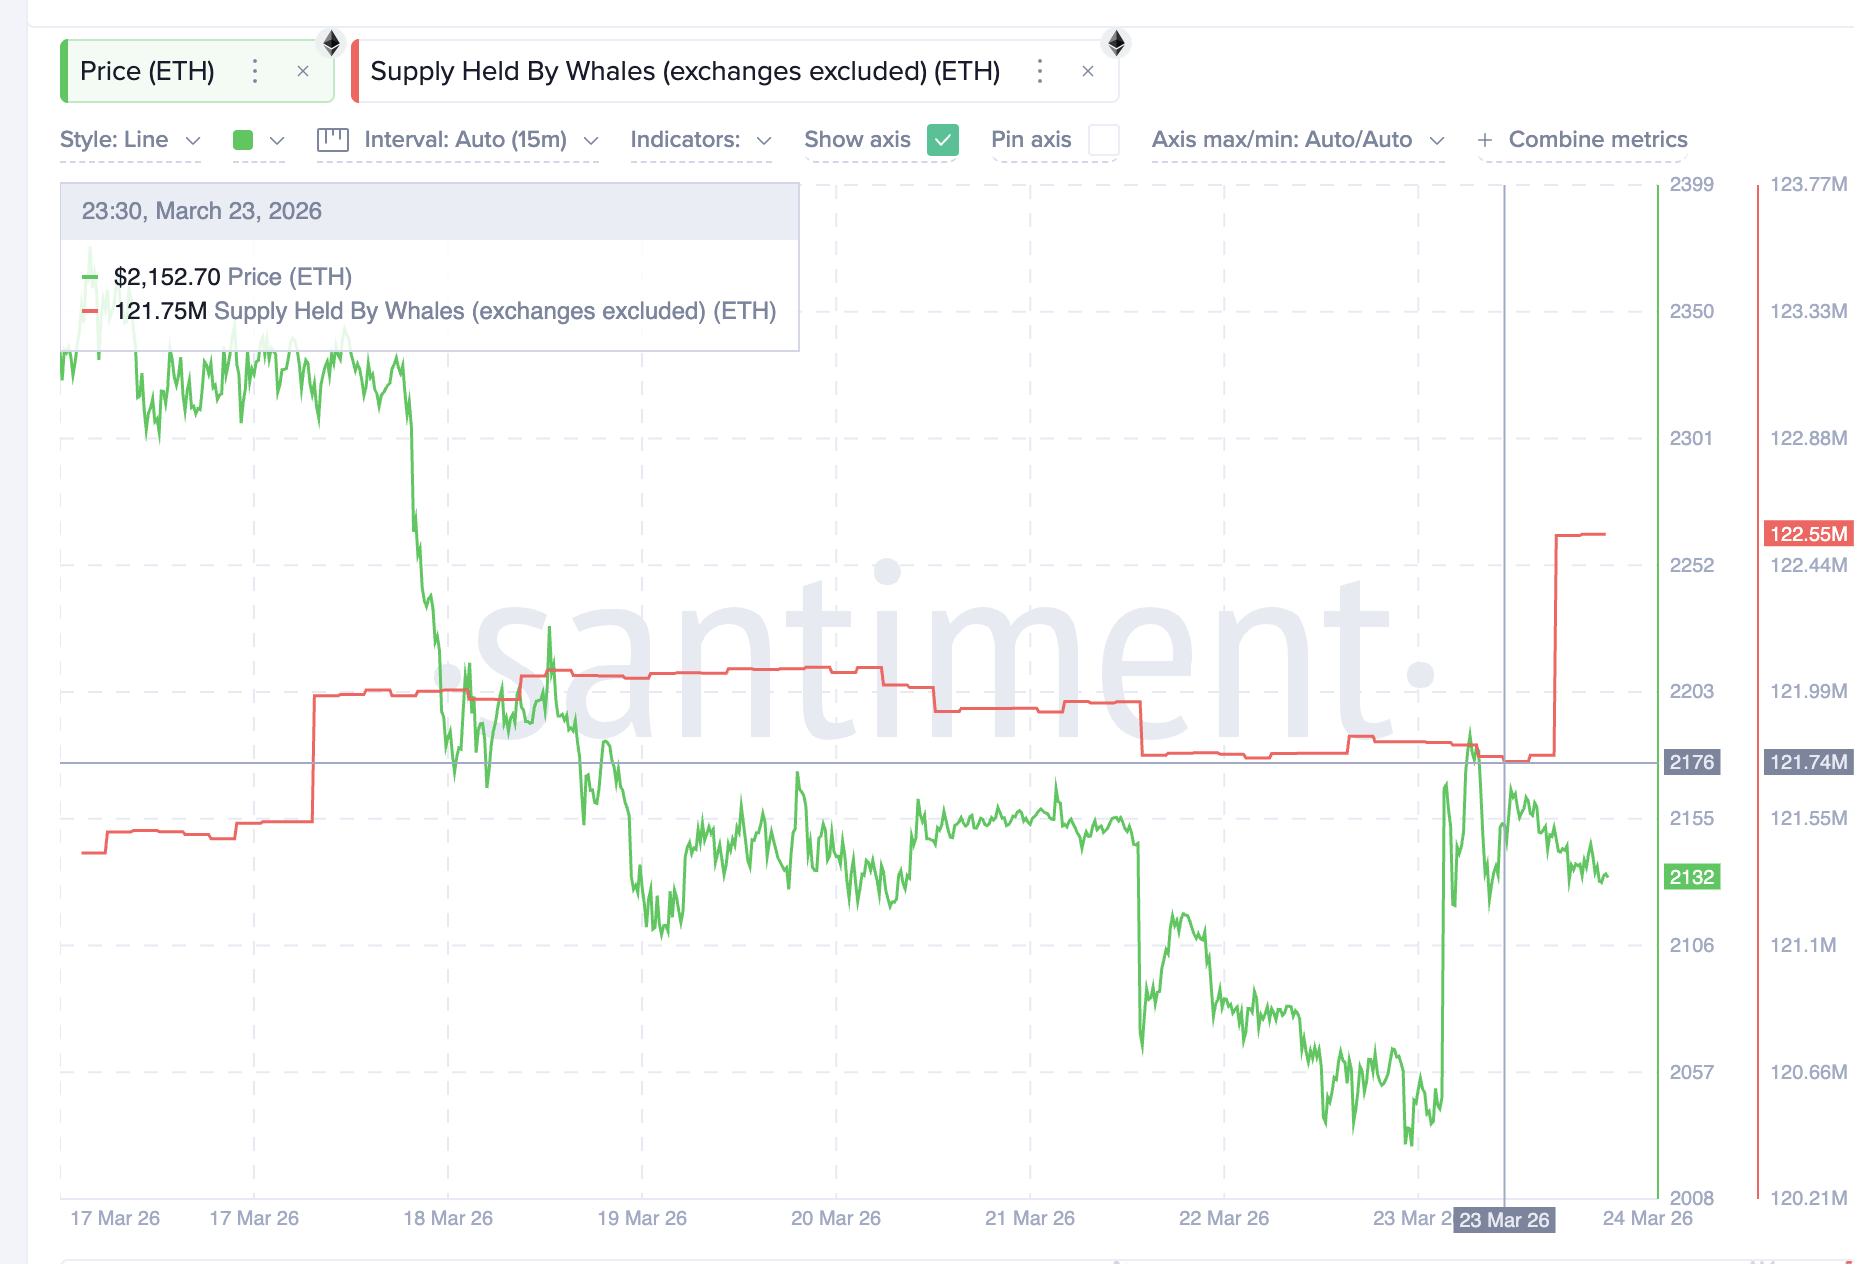
Ethereum whales have moved decisively. According to Santiment data, the supply held by whales (excluding exchange wallets) jumped from 121.74 million ETH on March 23 to 122.55 million ETH within 24 hours. That is a net addition of roughly 810,000 ETH in a single day, worth approximately $1.7 billion at current prices. The timing aligns with the intraday bounce, suggesting whales accumulated when strength flashed.
Want more token insights like this? Sign up for Editor Harsh Notariya’s Daily Crypto Newsletter here.
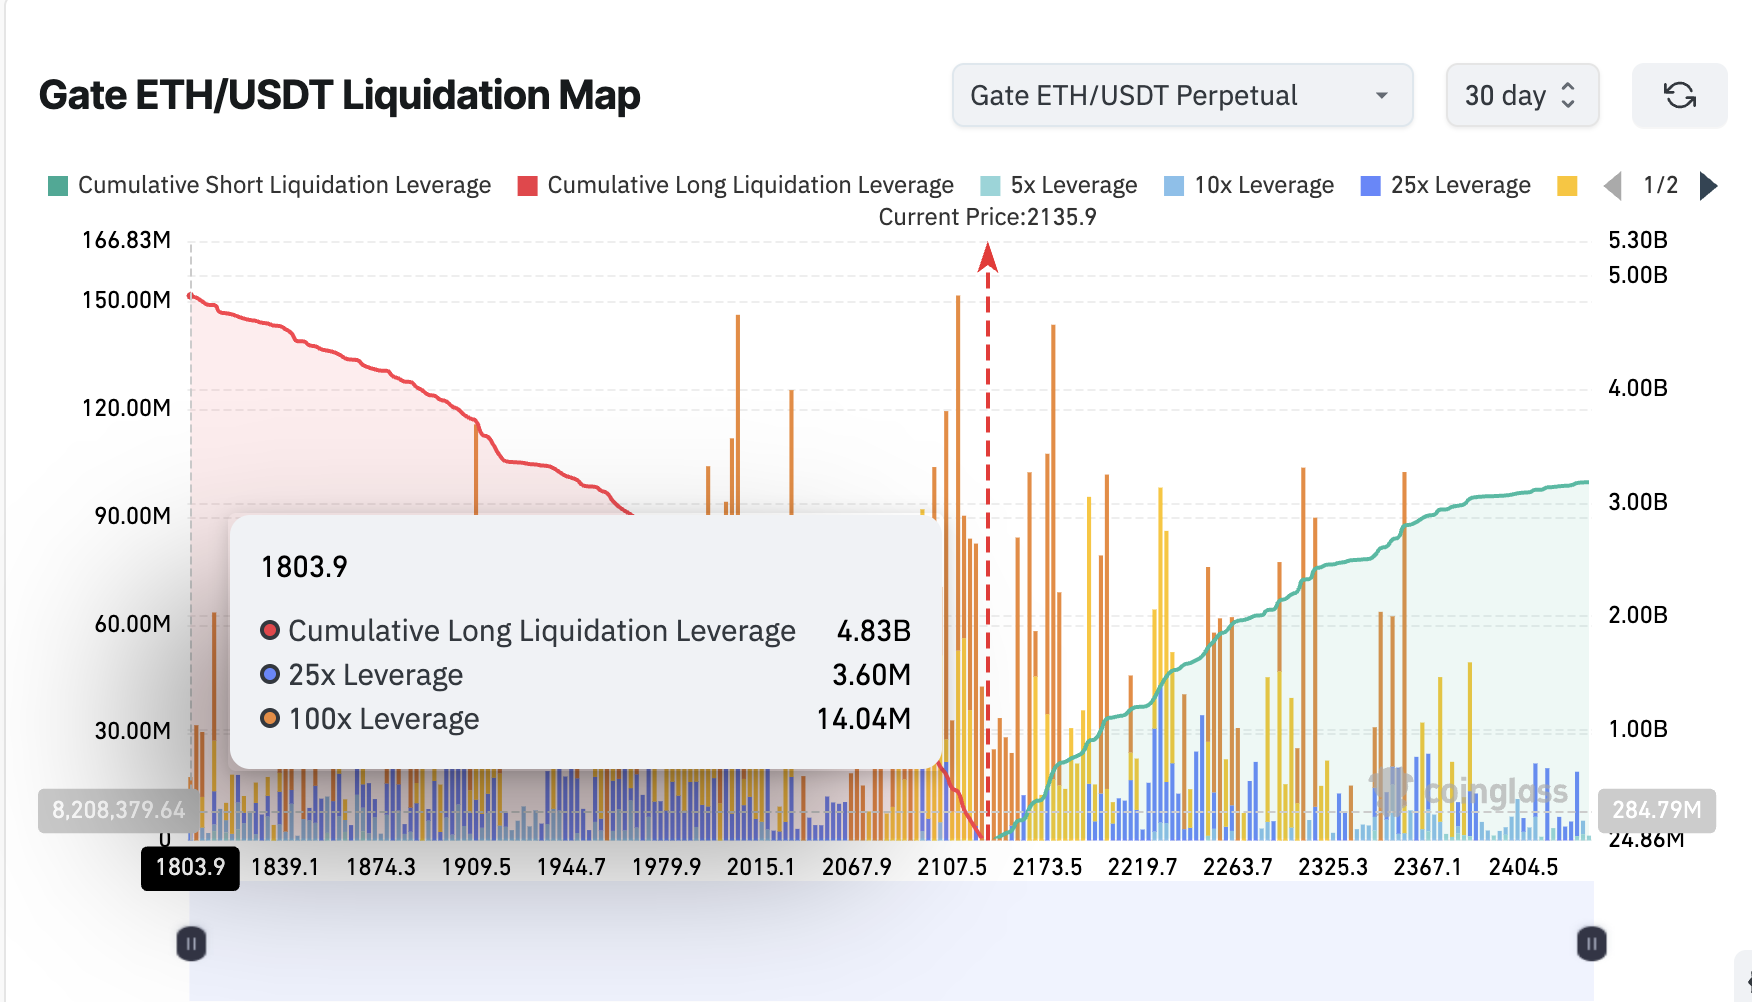
Ethereum derivatives positioning reinforces the bullish conviction. The Gate ETH/USDT perpetual liquidation map over the past 30 days (active ones) shows cumulative long leverage at $4.83 billion versus short leverage at $3.18 billion. That makes the long side approximately 52% larger. The market is heavily positioned for upside.
When whales buy spot and derivatives tilt long simultaneously, it usually indicates strong near-term conviction. However, conviction does not override chart structure. And the structure forming on the 8-hour chart is one the bulls should not ignore.
The 8-Hour Chart Builds a Pattern the Bulls May Be Missing
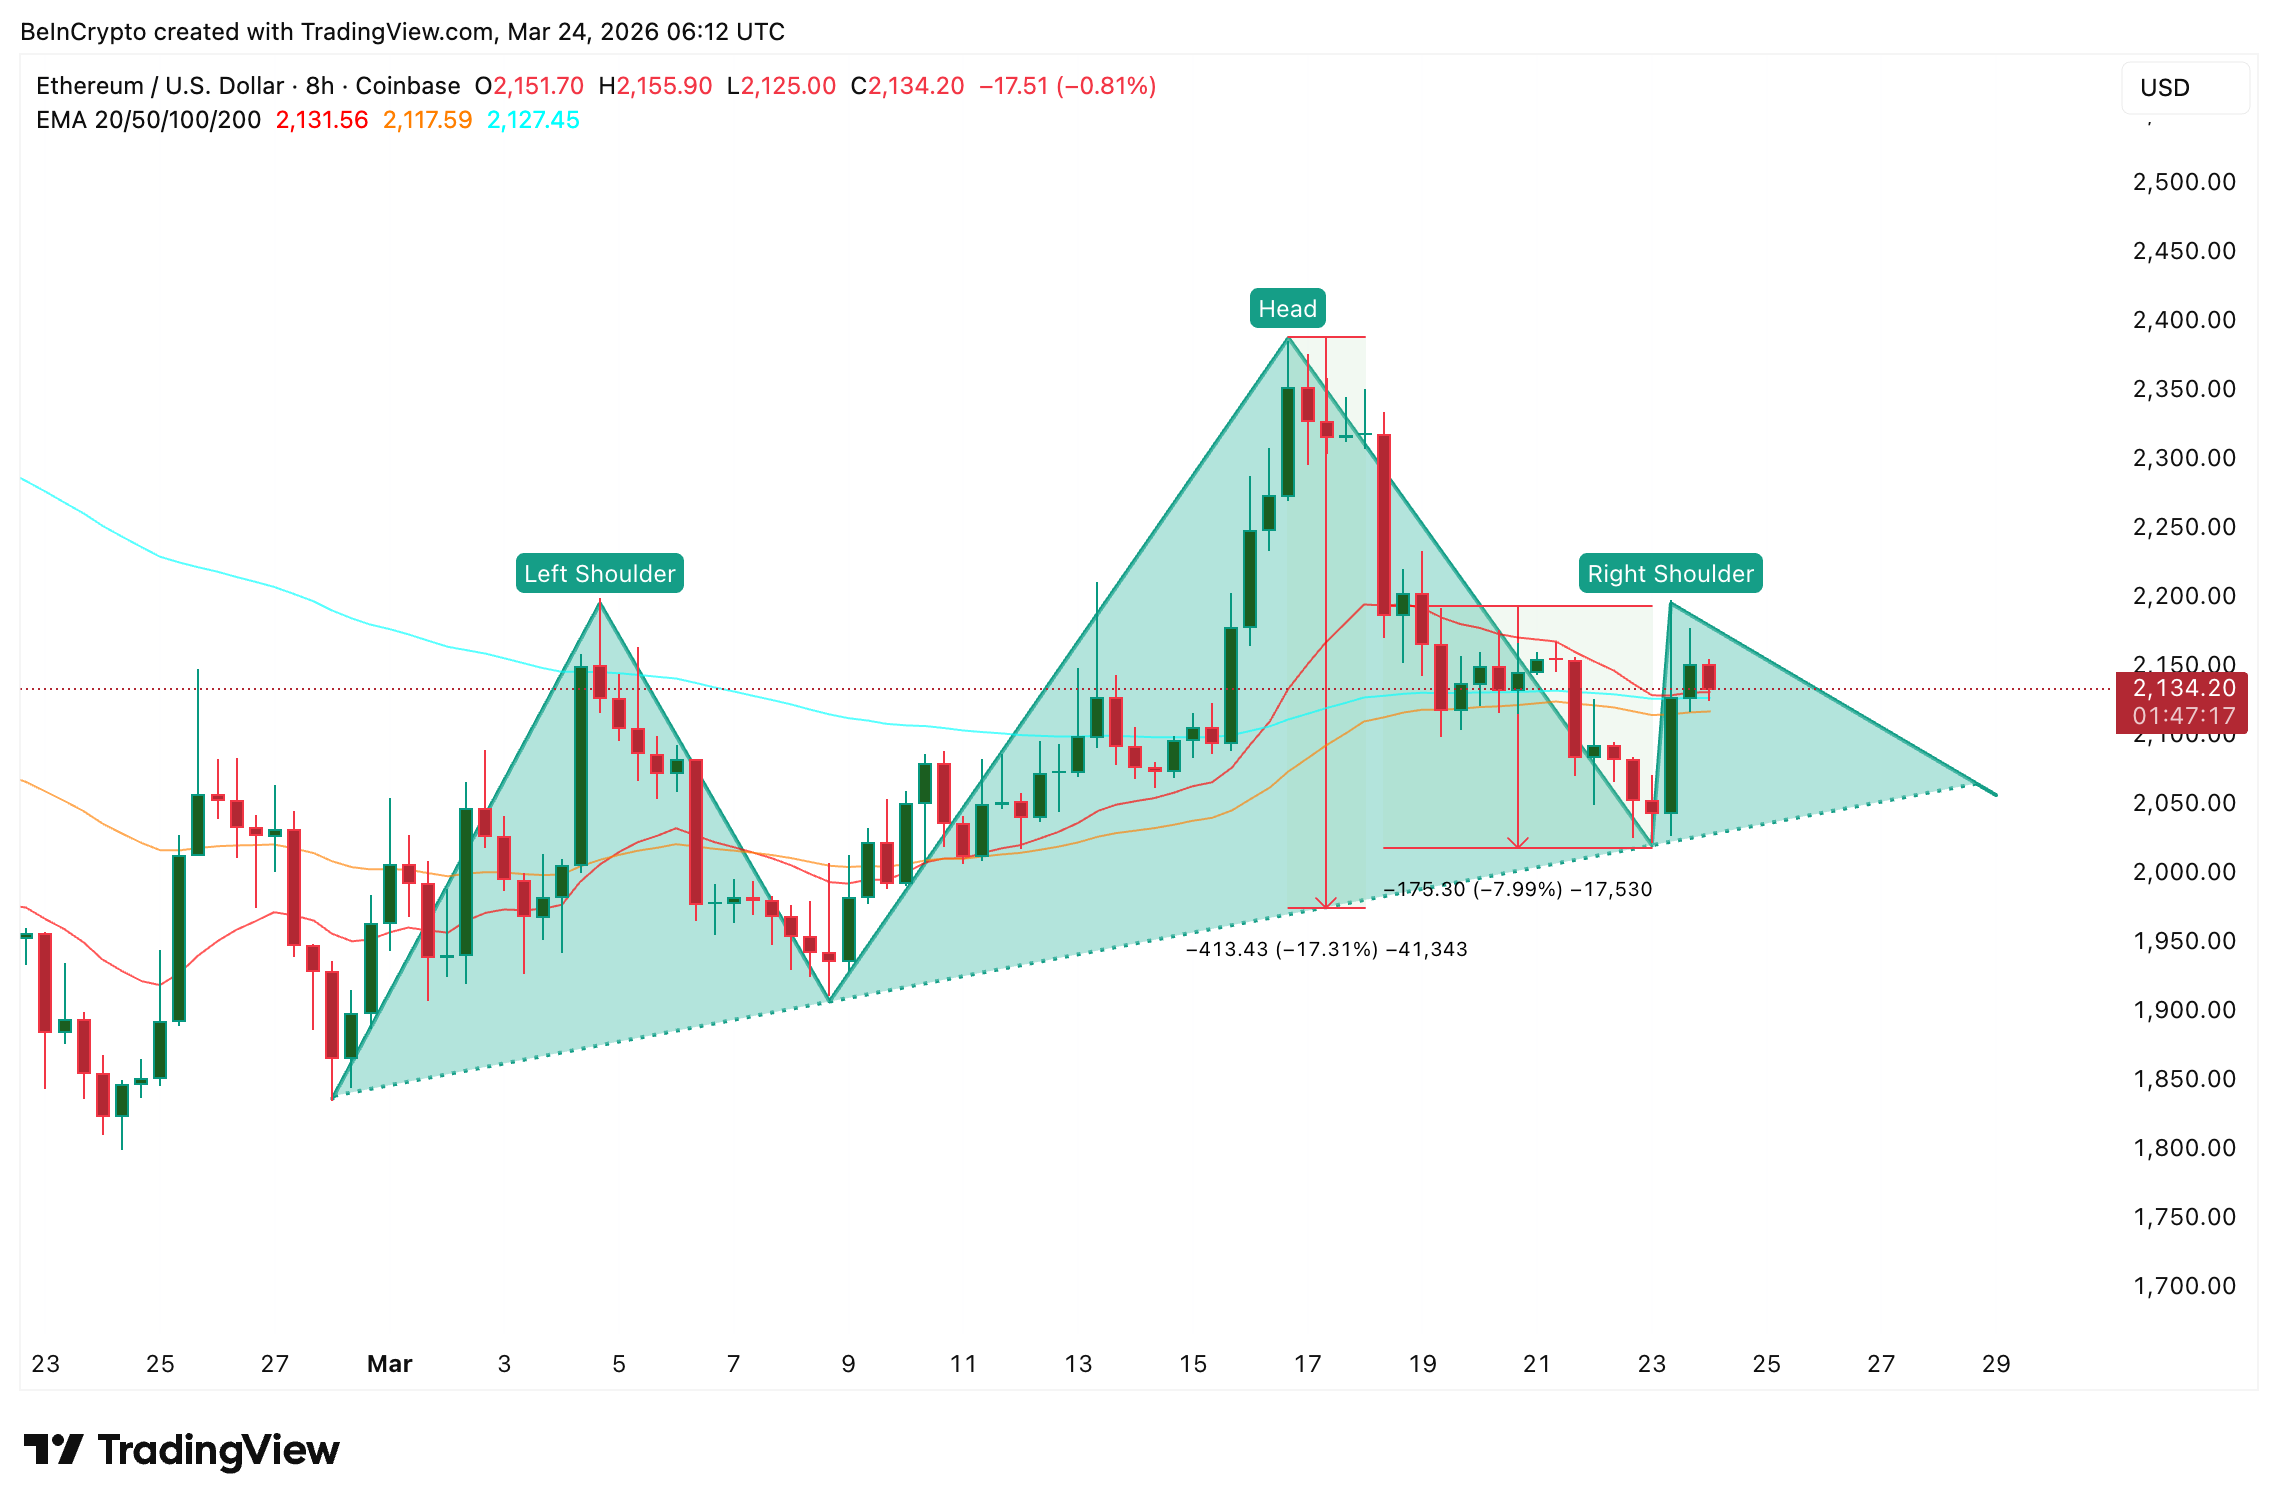
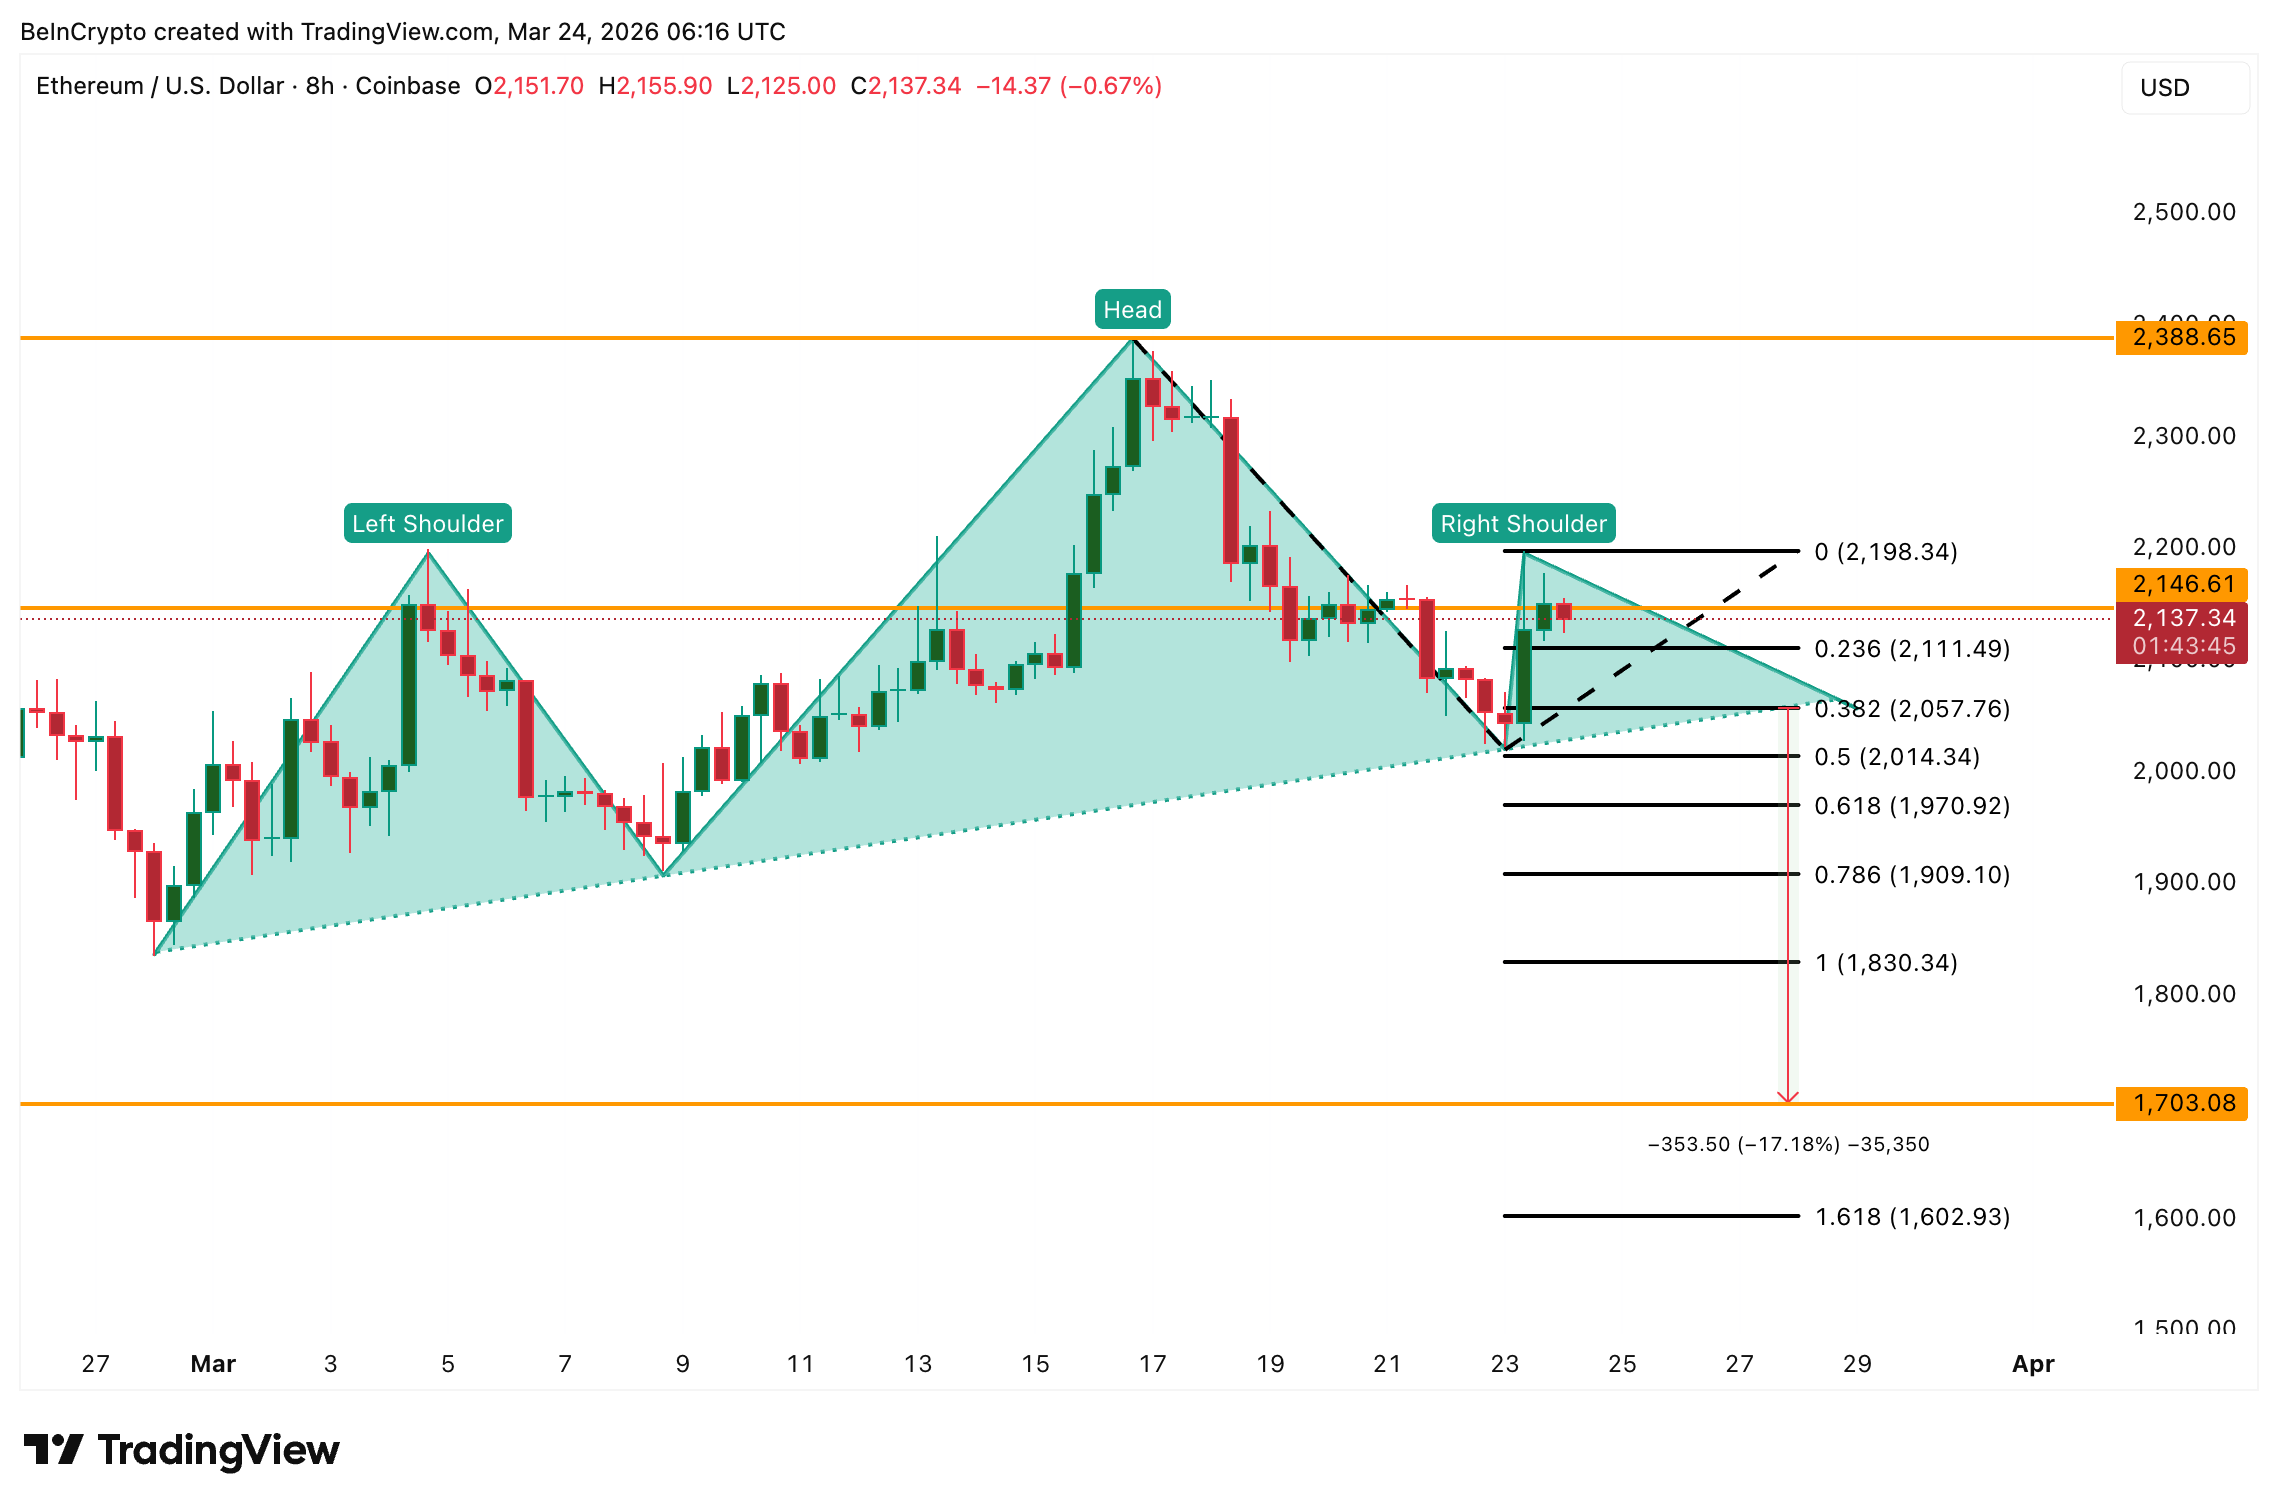
The 8-hour chart shows a head-and-shoulders pattern forming with an upsloping neckline and a 17% correction target. An upsloping neckline typically reflects persistent buying pressure underneath, which aligns with the whale accumulation. However, when that buying fails, the resulting move tends to be sharper because it removes the very floor buyers were relying on.
Adding to the risk, the Ethereum price currently sits directly on top of an EMA cluster. The 20, 50, and 100-period Exponential Moving Averages (EMAs), indicators that smooth price data to identify trend direction, all converge between $2,110 and $2,130. When multiple EMAs converge at one level, a break in either direction tends to accelerate. The last time ETH broke below the 20-period EMA on the 8-hour chart, on March 18, it corrected roughly 8%.
A bearish RSI divergence compounds the risk. Between February 25 and March 23, the ETH price made a higher high on the candles while the Relative Strength Index (RSI), a momentum indicator, made a lower high. Standard bearish divergence suggests upward momentum is weakening even as prices push higher.
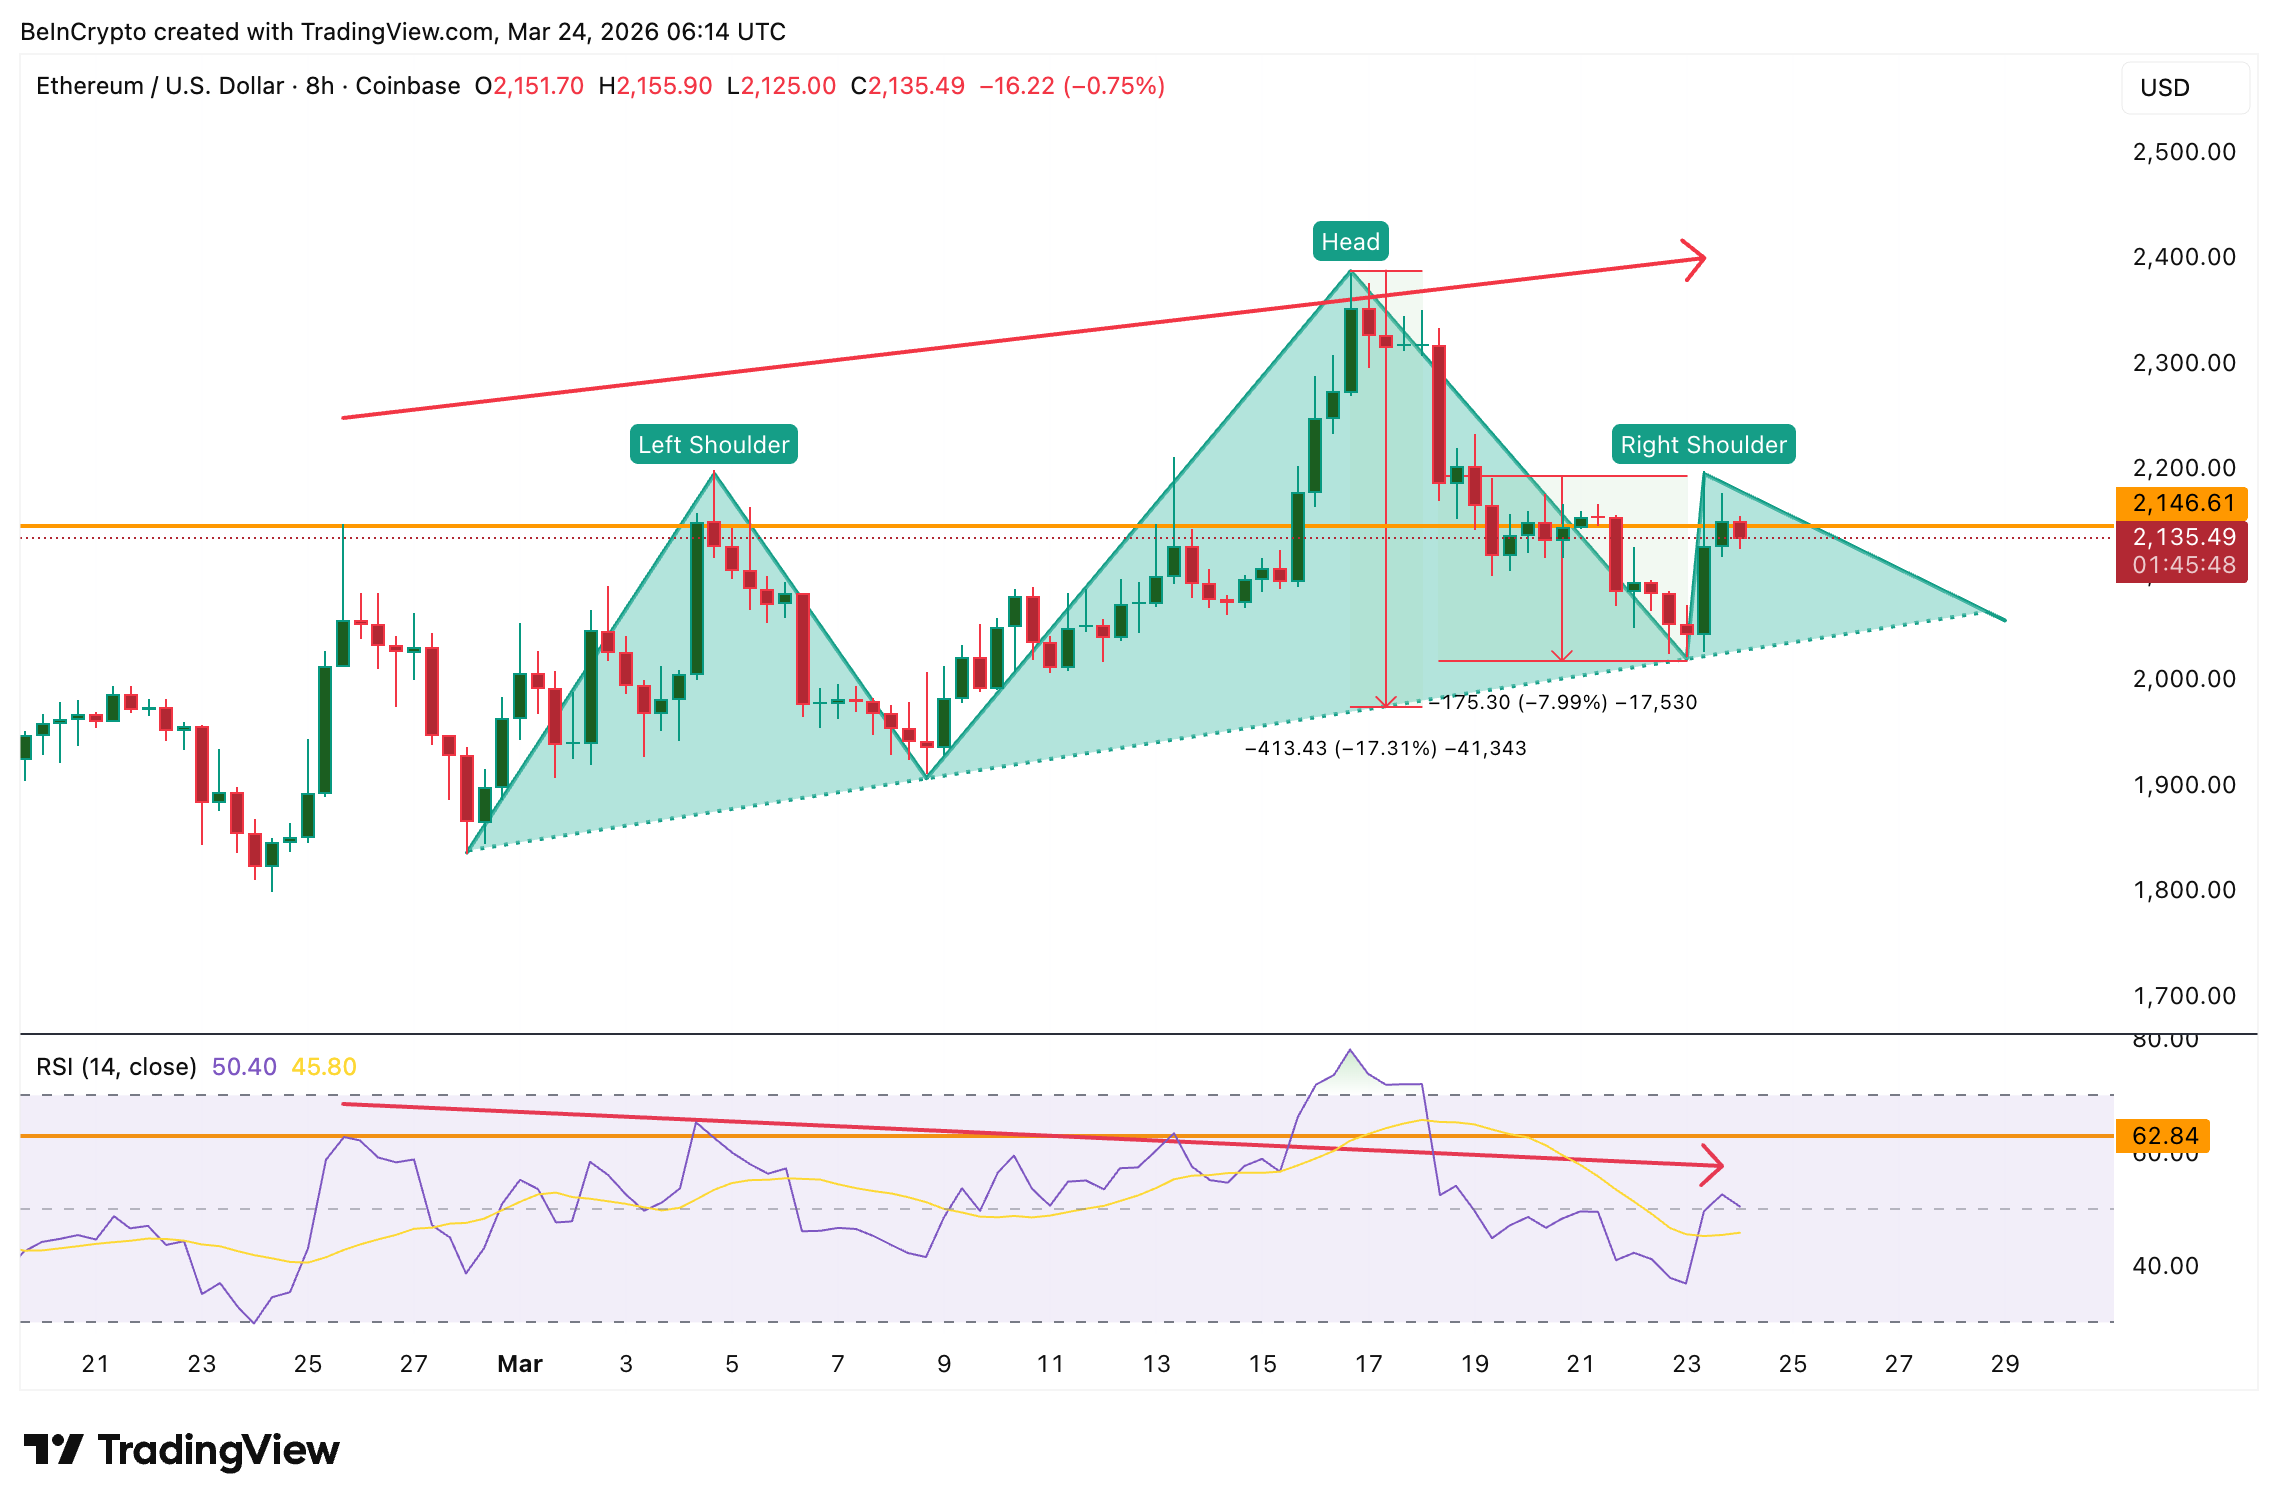
The head-and-shoulders, the EMA cluster at risk, and the bearish RSI divergence together paint a picture that contradicts the whale and derivatives optimism. The price levels will determine which narrative wins.
Ethereum Price Sits Right On The Crash Site
The immediate battleground is $2,110, which aligns with the lower end of the EMA cluster. An 8-hour close below this zone would break the moving average support and accelerate selling toward $2,050.
The $2,050 level is critical because it aligns with both the 0.382 Fibonacci level and the neckline of the head-and-shoulders pattern. If this zone breaks on an 8-hour close, the measured move activates. The head peaked near $2,380, and the pattern projects a roughly 17% decline from the neckline, targeting approximately $1,700. Along the way, $1,970 and $1,830 would act as intermediate stops. The worst-case extension sits near $1,600.
The ETH price dropping below $2,050 could also trigger a long liquidation cascade. With $4.83 billion in cumulative long leverage stacked below the current price, a neckline break would force leveraged longs to close, creating additional selling pressure that accelerates the move toward the H&S target. The very positioning that reflects bullish conviction becomes the fuel for the bearish scenario if the pattern confirms.
To invalidate the bearish pattern, ETH needs to reclaim $2,190 on an 8-hour close, followed by a push above the head near $2,380. Only then would the head-and-shoulders fail. Currently, the Ethereum price sits on an EMA cluster that separates whale-driven optimism from a 17% head-and-shoulders correction.
* The content presented above, whether from a third party or not, is considered as general advice only. This article should not be construed as containing investment advice, investment recommendations, an offer of or solicitation for any transactions in financial instruments.


