


Prediction: A Stock Market Crash Is Coming Eventually. Here's What Investors Should Do Based on What Happened in the Last 3 Crashes.
Key Points
The stock market has appreciated substantially over the last few years, mostly due to artificial intelligence (AI) euphoria.
Even with growth stocks sliding in recent trading sessions, the S&P 500 remains historically elevated.
The CAPE ratio is hovering near its highest reading in history, which could signal a crash is hiding in plain sight.
- Motley Fool Issues Rare "Total Conviction" Buy Alert ›
Over the last few years, both the S&P 500 (SNPINDEX:^GSPC) and Nasdaq Composite (NASDAQINDEX:^IXIC) have benefited enormously from enthusiasm surrounding artificial intelligence (AI). History suggests a downturn is inevitable at some point, though.
While this doesn't mean a crash is coming tomorrow, one useful valuation metric suggests investors should prepare for the possibility of outsize volatility. Let's analyze the last three stock market crashes and see what important lessons we can uncover about what investors should do when stocks eventually plunge.
Missed AI’s "Act 1"? Act 2 Could Be 15x Bigger. Most investors think they missed the AI boat because they didn't buy Nvidia in 2005. But according to our analysts, we’re only at the end of "Act 1"—the R&D phase. "Act 2" is the global rollout. Continue »

Image source: Getty Images.
The CAPE ratio suggests the stock market is overvalued
Developed by economist Robert Shiller, the cyclically adjusted price-to-earnings (CAPE) ratio compares the S&P 500's current price with its average inflation-adjusted earnings over the last 10 years. By smoothing out fluctuations in earnings per share (EPS), the CAPE ratio provides a longer-term perspective on stock market valuations.
Historically, the CAPE ratio has averaged approximately 18. But as of this writing (Nov. 13), it stands near 41. As the chart below illustrates, this places the stock market among its most expensive periods in history.
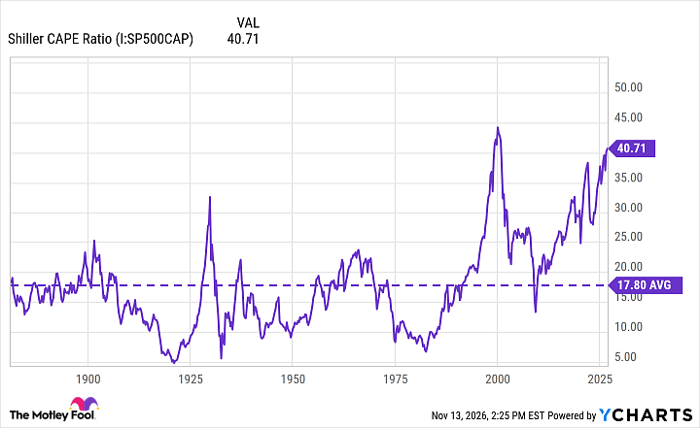
Shiller CAPE Ratio data by YCharts
For perspective, the CAPE ratio reached 44 in December 1999, right before the dot-com bubble burst. Generally, prolonged readings between 30 and 40 have indicated elevated valuations and, consequently, increased vulnerability to economic shocks.
There is an important caveat to point out. The CAPE ratio does not predict when a stock market crash will occur. Stocks can remain expensive for a long time and valuations can normalize through earnings growth rather than falling share prices.
In addition, not every market crash starts with a rising CAPE ratio. The metric is more useful for evaluating long-term return expectations rather than accurately forecasting short-term market movements.
Nevertheless, today's elevated reading suggests investors should be mindful of the risks associated with paying historically high prices for stocks.
What happened during the last three stock market crashes?
The last three major crashes reveal how painful market downturns can become.
- The dot-com crash (2000–2002): Following the collapse of speculative internet companies, the S&P 500 declined 49% between March 24, 2000, and Oct. 9, 2002. The technology-heavy Nasdaq plunged nearly 78% from its peak on March 10, 2000.
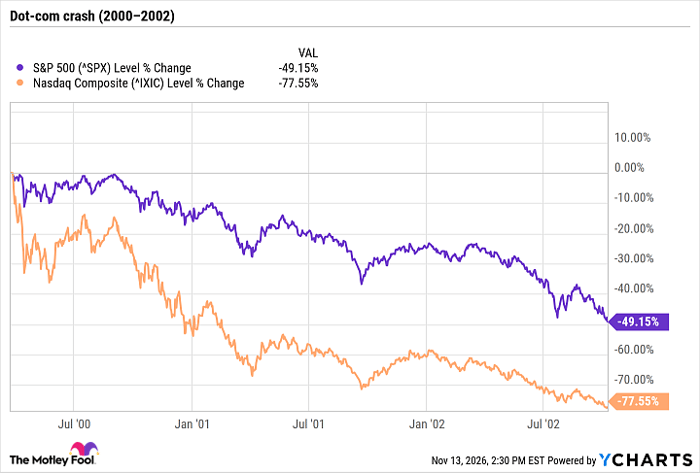
^SPX data by YCharts
- The Great Recession (2007–2009): The collapse in the housing market triggered another bear market during the mid-2000s. Between Oct. 9, 2007, and March 9, 2009, the S&P 500 lost 57% of its value while the Nasdaq dropped more than 50%.
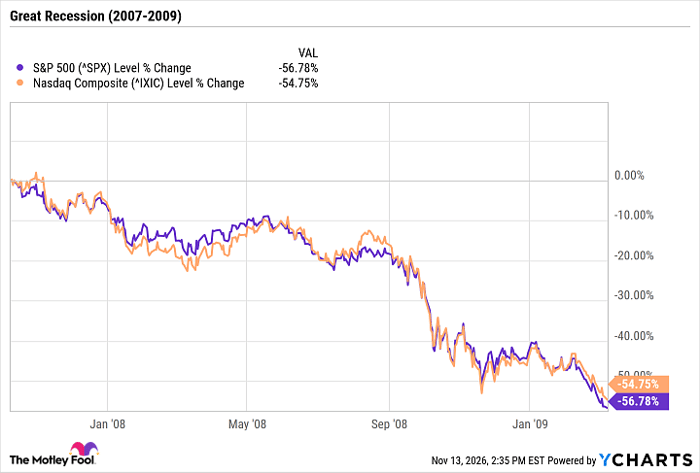
^SPX data by YCharts
- The COVID-19 crash (2020): Pandemic-related shutdowns triggered one of the fastest market collapses in history. Between Feb. 19 and March 23, 2020, the S&P 500 cratered 34%. The Nasdaq declined roughly 30% during the same period.
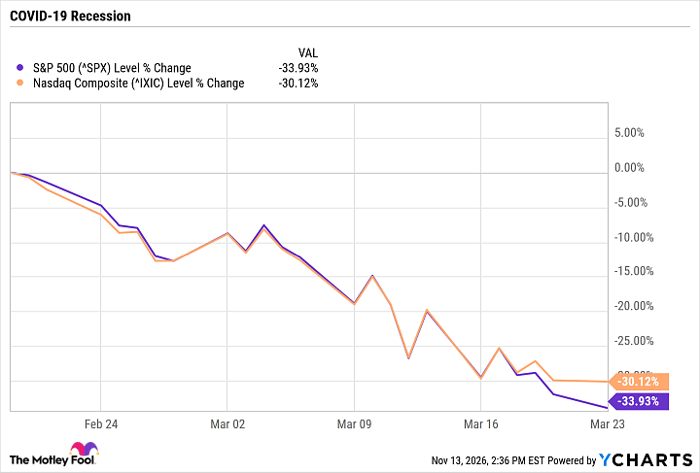
^SPX data by YCharts
The S&P 500 eclipsed its dot-com peak in May 2007, regained its pre-financial-crisis high in March 2013, and recovered its pre-pandemic record by August 2020. Despite their different causes, all three downturns eventually gave way to recoveries.
What $10,000 invested during these crashes would be worth today
Let's consider what would have happened if an investor bought an S&P 500 index fund near the bottom of each downturn and held that investment through today.
| Investment Date | S&P 500 Closing Level | $10,000 Investment Today (rounded) |
|---|---|---|
| Oct. 9, 2002 | 777 | $98,000 |
| March 9, 2009 | 676 | $112,200 |
| March 23, 2020 | 2,237 | $34,000 |
Data source: Finabase.
These examples assume an investor purchased shares at the bottom, which is something that's nearly impossible to accomplish consistently. That's not the real takeaway, though.
The lesson here is that investors who held a diversified portfolio and remained invested through periods of uncertainty and volatility were ultimately rewarded by the stock market's resilience.
This is why buy-and-hold investing and a long-term outlook are the most effective strategies for navigating volatility. Investors can also use dollar-cost averaging to purchase stock regularly, reducing the temptation to time market bottoms.
Another stock market crash will eventually occur, although nobody knows when. History shows that investors who avoid emotional panic-selling and maintain a long-term time horizon will be better positioned to benefit from the inevitable recovery.
Should you buy stock in S&P 500 Index right now?
Before you buy stock in S&P 500 Index, consider this:
The Motley Fool Stock Advisor analyst team just identified what they believe are the 10 best stocks for investors to buy now… and S&P 500 Index wasn’t one of them. The 10 stocks that made the cut could produce monster returns in the coming years.
Consider when Netflix made this list on December 17, 2004... if you invested $1,000 at the time of our recommendation, you’d have $335,171!* Or when Nvidia made this list on April 15, 2005... if you invested $1,000 at the time of our recommendation, you’d have $1,000,640!*
Now, it’s worth noting Stock Advisor’s total average return is 823% — a market-crushing outperformance compared to 208% for the S&P 500. Don't miss the latest top 10 list, available with Stock Advisor, and join an investing community built by individual investors for individual investors.
See the 10 stocks »
*Stock Advisor returns as of November 16, 2026.
Adam Spatacco has no position in any of the stocks mentioned. The Motley Fool has no position in any of the stocks mentioned. The Motley Fool has a disclosure policy.
Recommended Articles


