


History Says Investors Should Listen to Warren Buffett: The S&P 500 Is on the Verge of Doing Something for the First Time in 155 Years as Investors Buy "Nothing But Hope."
Key Points
The S&P 500 Shiller CAPE ratio is on the verge of reaching its highest reading in 155 years.
At its current level, the CAPE ratio suggests valuations are overextended.
Berkshire Hathaway is sitting on a record amount of cash as stock prices continue to soar.
- 10 stocks we like better than S&P 500 Index ›
During a recent interview on CNBC, Warren Buffett offered a characteristically direct assessment of the current stock market climate. The "Oracle of Omaha" discussed the challenges of finding genuine value when investors are drawn more toward speculative buying than thorough due diligence.
At its core, Buffett's observation touches on a dynamic in which buyers seem to be investing in "nothing but hope" -- betting on future outcomes that may never materialize. Buffett's view prompts deeper analysis of how the stock market behaves when enthusiasm outpaces fundamentals and what that could mean for investors as the S&P 500 (SNPINDEX: ^GSPC) continues to march higher.
Where to invest $1,000 right now? Our analyst team just revealed what they believe are the 10 best stocks to buy right now, when you join Stock Advisor. See the stocks »
Image source: Getty Images.
Berkshire's measured retreat from stocks
Berkshire Hathaway has employed a cautious posture in recent years. Rather than aggressively deploying capital across the market, the investment conglomerate has actually been a net seller of stocks. Berkshire has steadily reduced its stake in major holdings such as Apple, while exiting a number of smaller positions altogether in recent quarters. At the same time, Berkshire has built its cash reserves to grow substantially, creating the largest pool of uncommitted capital in its long history.
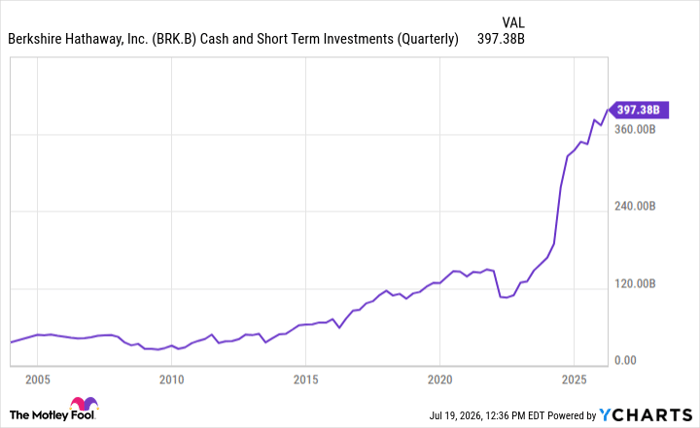
BRK.B Cash and Short Term Investments (Quarterly) data by YCharts
This strategy reflects more than simple profit-taking. Rather, it's a deliberate preference for patience rather than chasing momentum higher. Even when selective opportunities have been pursued -- such as building exposure to Alphabet -- the overarching approach has been tempered.
By opting for liquidity over aggressive capital allocation, Berkshire is preserving flexibility for periods when genuine bargains might reemerge. This strategy underscores a core principle: Capital should be deployed when the risk-reward profile clearly indicates a favorable outcome -- not merely because stock prices are rising or sentiment feels strong.
What frothy valuations reveal through the CAPE ratio
One of the most useful tools for evaluating whether markets offer fair value is the cyclically adjusted price-to-earnings (CAPE) ratio. This metric is calculated by taking current stock prices and comparing them to the average inflation-adjusted earnings during a full decade. By doing so, the CAPE ratio smooths out financial distortions seen during economic booms and recessions. The broader purpose of this ratio is to provide a longer-term sense of whether investors are paying reasonable prices relative to actual earning power.
When the CAPE ratio climbs above its historical norm, it typically indicates that stock prices embed optimistic assumptions about future growth. Currently, the CAPE boasts a reading of 41 -- more than double its long-term average of 17.8. Moreover, this is the highest level the CAPE ratio has reached since the dot-com boom in the late 1990s, which was followed by a protracted bust. At its current pace, the CAPE ratio is on the verge of possibly eclipsing its peak of 44, marking its highest level in 155 years.
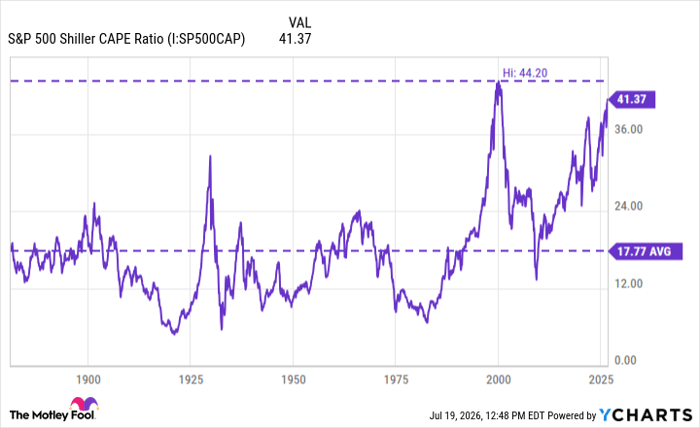
S&P 500 Shiller CAPE Ratio data by YCharts
The current level of the CAPE ratio suggests that a meaningful portion of today's prices hinge on expectations of sustained valuation expansion, technological breakthroughs, and continued economic resilience. This type of environment echoes Buffett's concern about investing chasing momentum-driven hope.
Just as earlier speculative episodes priced in bullish scenarios that proved uncertain and uneven in their outcomes, today's valuation multiples leave little room for disappointment. When stock prices become detached from underlying business fundamentals, the margin for error shrinks and prices eventually revert as expectations become more aligned with reality.
How should you invest in 2026?
Given the current conditions, investors are best served by employing enduring disciplines rather than attempting to outguess short-term fluctuations. Dollar-cost averaging helps remove emotion from the equation as it ensures participation across varying price levels and different market cycles. This strategy acknowledges that no one can accurately predict the perfect entry point and instead focuses on steady accumulation over a long-term horizon.
Additionally, concentrating on high-quality companies with competitive advantages, strong balance sheets, and the capacity to compound value over time provides a more durable foundation than chasing the latest theme. Diversification across these businesses further reduces the impact of any single earnings surprise.
Meanwhile, holding a cash reserve alongside stocks serves dual purposes: It offers protection during periods of volatility and provides dry powder for opportunities that may appear attractive when sentiment cools.
Ultimately, Buffett's comments showcase that the stock market can remain elevated for extended stretches without immediate consequence. The response is not to abandon stocks altogether, but rather to buy them with more selectivity. By emphasizing patience and a clear-eyed view of valuation, smart investors can more easily navigate periods of widespread froth. The ultimate goal should always be to own sound businesses at reasonable prices that eventually reward time and discipline over fleeting hope.
Should you buy stock in S&P 500 Index right now?
Before you buy stock in S&P 500 Index, consider this:
The Motley Fool Stock Advisor analyst team just identified what they believe are the 10 best stocks for investors to buy now… and S&P 500 Index wasn’t one of them. The 10 stocks that made the cut could produce monster returns in the coming years.
Consider when Netflix made this list on December 17, 2004... if you invested $1,000 at the time of our recommendation, you’d have $371,842!* Or when Nvidia made this list on April 15, 2005... if you invested $1,000 at the time of our recommendation, you’d have $1,244,783!*
Now, it’s worth noting Stock Advisor’s total average return is 900% — a market-crushing outperformance compared to 207% for the S&P 500. Don't miss the latest top 10 list, available with Stock Advisor, and join an investing community built by individual investors for individual investors.
See the 10 stocks »
*Stock Advisor returns as of July 21, 2026.
Adam Spatacco has positions in Alphabet. The Motley Fool has positions in and recommends Alphabet, Apple, and Berkshire Hathaway. The Motley Fool has a disclosure policy.
Recommended Articles


