


VOO vs. VTI: If a Bear Market Is Coming, Here's Which One I'm Stocking Up On
Key Points
The Vanguard S&P 500 ETF and Vanguard Total Stock Market ETF both offer broad exposure to U.S. stocks.
The Total Stock Market ETF is more diversified, which could give it an advantage if tech stocks falter.
- 10 stocks we like better than Vanguard Total Stock Market ETF ›
Major market indexes have been soaring lately, with the S&P 500 (SNPINDEX: ^GSPC), Nasdaq Composite (NASDAQINDEX: ^IXIC), and Dow Jones Industrial Average (DJINDICES: ^DJI) up by 74%, 89%, and 61%, respectively, over the last three years. However, no bull market can last forever, so it's only a matter of time before the next downturn hits.
The Vanguard S&P 500 ETF (NYSEMKT: VOO) and the Vanguard Total Stock Market ETF (NYSEMKT: VTI) are both strong choices, but there's one I plan to stock up on to prepare for the next bear market.
Missed Nvidia in 2009? This Rare Signal Is Flashing Again. In 2009, a "Double Down" signal flashed for a little-known chipmaker called Nvidia. For the first time in years, that same "Total Conviction" signal is flashing for a company 1/100th the size of Nvidia. Continue »

Image source: Getty Images.
One key differentiator to consider
These two ETFs are similar in many ways. They both track the broader market, aiming to capture a large swath of U.S. stocks. However, the Total Stock Market ETF's diversification could give it an edge during the next downturn.
Both ETFs share the same top 10 holdings, all of which are tech stocks. Most of them -- like Apple, Microsoft, Nvidia, and Google parent company Alphabet -- are also heavily focused on the development of AI technology.
While the two funds have identical top holdings, those 10 stocks account for nearly 40% of the S&P 500 ETF's portfolio, compared to around 35% for the Total Stock Market ETF. It's a subtle difference, but it suggests that the Total Stock Market ETF may be slightly less vulnerable to volatility within the AI space.
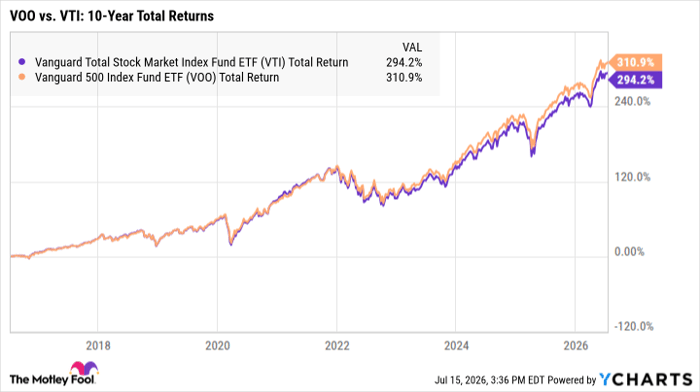
VTI Total Return Level data by YCharts
The drawback to a smaller tilt toward tech is that the Total Stock Market ETF may underperform the S&P 500 ETF when the AI industry is booming. As tech stocks have soared in recent years, the S&P 500 has edged slightly ahead -- earning total returns of around 311% compared to around 294% for the Total Stock Market ETF.
Where you choose to buy will depend on your risk tolerance and preferences. The two funds are similar in most respects, but as the S&P 500 becomes increasingly dominated by tech, the Vanguard Total Stock Market ETF could offer a slight edge in diversification.
Should you buy stock in Vanguard Total Stock Market ETF right now?
Before you buy stock in Vanguard Total Stock Market ETF, consider this:
The Motley Fool Stock Advisor analyst team just identified what they believe are the 10 best stocks for investors to buy now… and Vanguard Total Stock Market ETF wasn’t one of them. The 10 stocks that made the cut could produce monster returns in the coming years.
Consider when Netflix made this list on December 17, 2004... if you invested $1,000 at the time of our recommendation, you’d have $397,351!* Or when Nvidia made this list on April 15, 2005... if you invested $1,000 at the time of our recommendation, you’d have $1,304,257!*
Now, it’s worth noting Stock Advisor’s total average return is 934% — a market-crushing outperformance compared to 210% for the S&P 500. Don't miss the latest top 10 list, available with Stock Advisor, and join an investing community built by individual investors for individual investors.
See the 10 stocks »
*Stock Advisor returns as of July 17, 2026.
Katie Brockman has positions in Vanguard S&P 500 ETF and Vanguard Total Stock Market ETF. The Motley Fool has positions in and recommends Alphabet, Apple, Microsoft, Nvidia, and Vanguard S&P 500 ETF. The Motley Fool has a disclosure policy.
Recommended Articles


