


TSMC (TSM) Stock Forecast: June Revenue Up 68%, Q2 Earnings Tomorrow; Is $438 the Next Stop?
TradingKey - At press time, the TSMC stock price (NYSE: TSM) is trading around $426.62, a position that places it above the trendline, 100-period EMA at $422.87 and demand at $418.95. The stock is down 2% in the last week, following an approximate 10% pullback from the high of $474.71, even as shares are 52% higher in 2026 YTD.
TSMC is scheduled to release Q2 full earnings results at 2:00 PM Taiwan time on Thursday, July 16. As a reminder, June 2026 revenue was NT$442.68 billion, up 67.9% from June 2025 while H1 2026 revenue totaled NT$2,404.48 billion, up 35.6% year-over-year. Analysts currently expect Q2 to come in at $39.5 to $40.2 billion with EPS of $3.83 (up 55% YoY). The RSI at 44 is neutral with room to run up on a close above $426.62, the level for resistance sits at $437.98.
What We Already Know About Q2 from the June Revenue Release
Q2 earnings report will confirm June revenue and reveal full profit margins. TSMC releases monthly revenue numbers, so tomorrow’s release will not mark the first revenue glimpse, but the first look at the full earnings report for Q2 2026, which will include profit margins. From its earnings report on the June monthly release with the SEC, revenue was 67.9% from a year ago at NT$442.68 billion, up 6.2% from May 2026.
As a result, it now is likely that Q2 revenue will surpass $39.6 billion (the midpoint of the $39.0 to $40.2 billion range TSMC had previously guided) and be well within the consensus range of $39.5 to $39.8 billion. Thus, there are no real revenue surprises coming up in any direction when the company releases its full Q2 2026 results tomorrow.
However, the monthly reports don’t include margins, which were the real unknown in TSMC’s June 2026 revenue report. TSMC guided 2026 Q2 gross margin between 65.5% to 67.5%, with Q1 gross margin being 66.2%, which was high-end for that quarter’s guidance. Now the big question is whether Q2 gross margins will remain above 65.5% as TSMC continues to ramp up new Arizona facilities that have relatively high operating costs at first compared to the company’s existing, more efficient plants in its home country Taiwan.
As the global foundry leader with a 73% market share in 2026 Q1 for advanced foundry demand, TSMC also began volume production ramp for the N2 2-nanometer process for customers including Apple, Nvidia and AMD. The company’s next unknown includes information on the N2 yields and timing of that ramp.
The Call for July 16 Has 3 Major Items to Confirm
Here are the three major items to know about this quarter’s conference call:
- Third-quarter variable There is a major third-quarter variable, which has a major influence on investor outlook. TSMC so far this year has been projecting a full year of 2026 growth of over 30% in U.S. dollar terms. Thus, if Q3 guidance shows the second half of 2026 will be a major slowdown to hit those projections, expect the stock to be giving away some, if not all, of this month’s bounceback, if the third quarter forecasts a slowdown. If guidance is accelerating, the market would likely see AI demand remaining strong for CoWoS advanced packaging shipments, HBM packaging and N3/N2 logic wafer demand. Analysts expect Q3 EPS to be $4.00 to $4.20, implying that momentum is still building.
- Capex A second major variable on the call will be capex, since TSMC has been running capex expenses at $38 billion to $42 billion per year. Any call for higher capex would be a sign that management expects AI-driven demand to remain high through 2027-2028, while a cut or at least steady capex numbers in a range would lead investors to question if infrastructure outlays related to AI are peaking.
- Pricing The third major variable on the call will be pricing, as TSMC has already initiated selective price hikes for certain advanced nodes over the last 18 months. CEO C.C. Wei will have another opportunity to speak on if another round of price increases will take place in 2027, a move that would boost the company’s gross margins next year.
TSM Technical Analysis: Trendline at $422, RSI 44, Key Levels Into Earnings
The daily chart shows TSMC shares at $426.62 trading above the trendline, 100-period EMA at $422.87 and demand zone at $418.95. The 44 RSI is neutral and has plenty of room to run higher. Resistance is at $437.98.
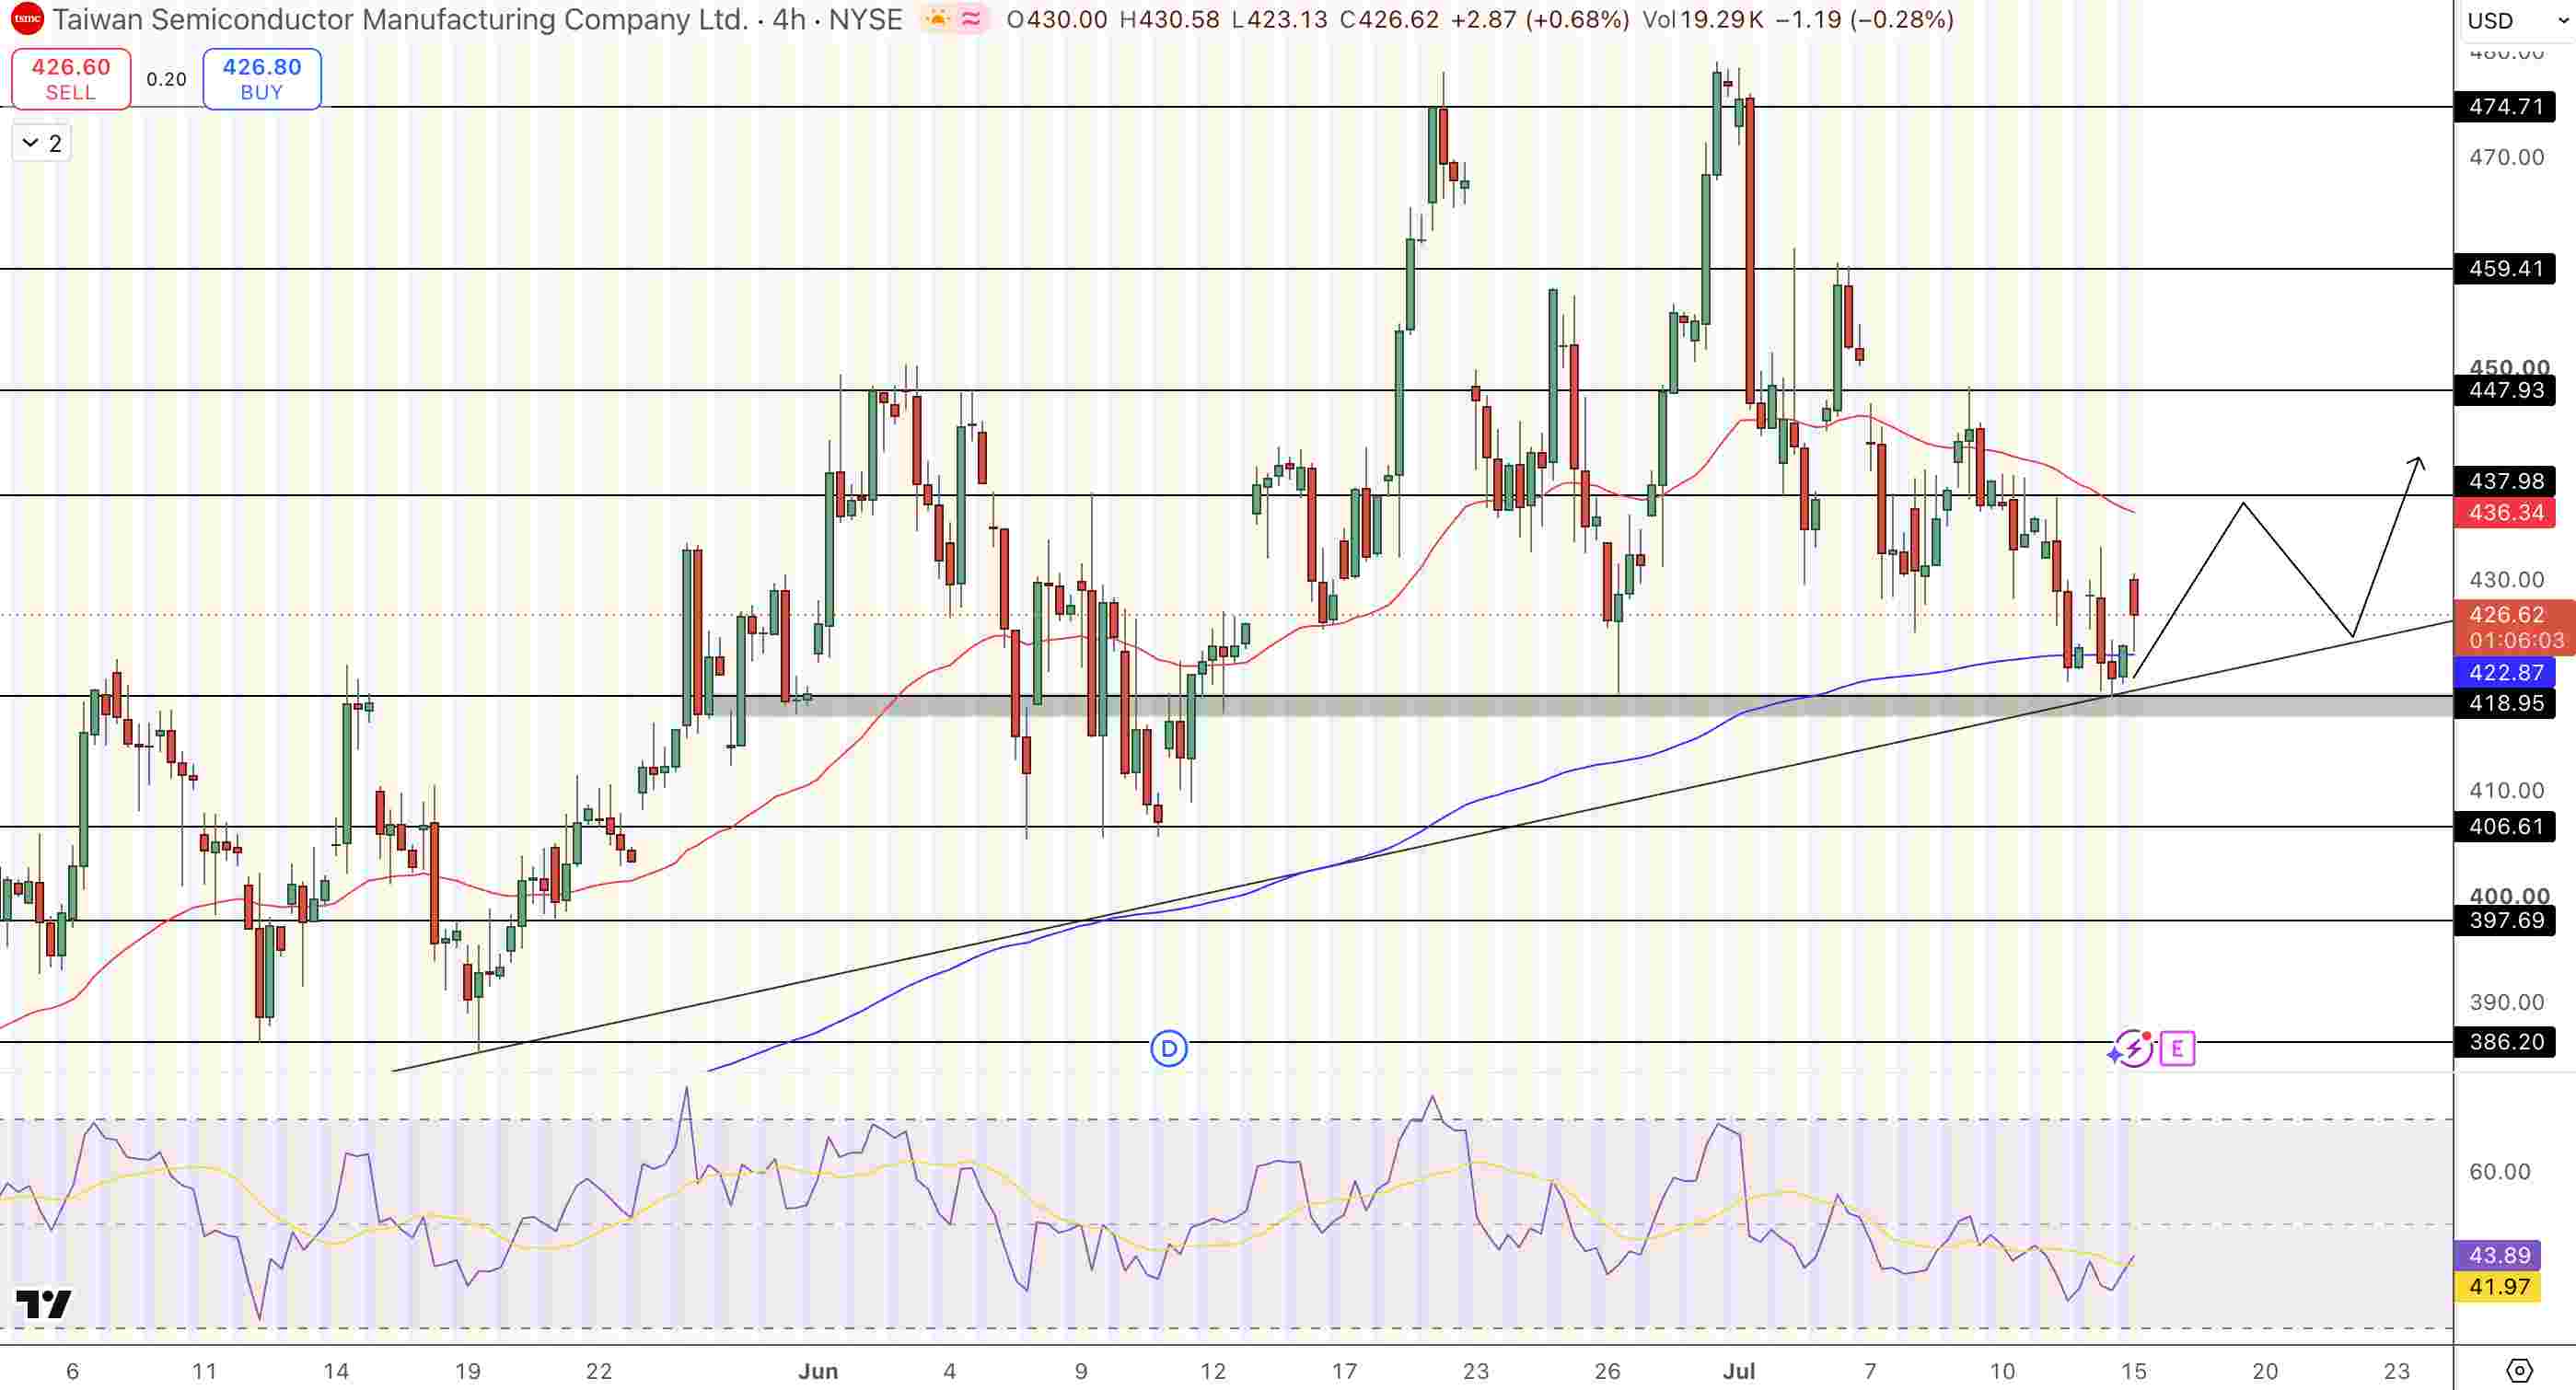
TSMC (TSM) Stock Forecast Price Chart - Source: Tradingview
Should the stock close above the 50-period EMA, which is currently at $436.34 on a daily chart, that would set up potential for a move up toward the first upside target at $437.98, followed by $447.93 and then $459.41. A close below $418.95 would indicate the next downside targets to be $406.61 and then $397.69.
Earnings Data
- Q2 2026 Earnings Results: Thursday, July 16, 2026 at 2:00 PM Taiwan time
- Current Q2 consensus: $39.5 to $40.2 billion Revenue and $3.83 EPS (up 55% from last year) with a gross margin of 65.5% to 67.5%.
- June 2026 Revenue: NT$442.68 billion (+67.9% year-over-year, +6.2% month-over-month)
- TSMC guided Q2 revenue for 2026 Q2 at $39.0 to $40.2 billion
- First half 2026 revenue (YTD): NT$2,404.48 billion (up 35.6%)
- Q3 expected earnings of EPS $4.00 to $4.20
When Does TSMC Report Q2 2026 Earnings?
TSMC released its full Q2 2026 earnings report Thursday, July 16, 2026 at 2:00 PM (14:00) Taiwan time, which is roughly 2:00 AM ET. It will reveal revenue and gross/operating margins and provide Q3 guidance. Additionally, monthly April, May and June revenue is already filed with the SEC. This revealed that first half of 2026 revenue totals NT$2,404.48 billion (35.6% YoY). Analysts currently have a consensus of $39.5 to $40.2 billion for Q2 and $3.83 for EPS, equating to around 55% EPS growth YoY.
Why Is TSMC’s Stock Down 10% From Its High Despite Strong Revenue?
TSM gave back around 10% from a high of $474.71 to the current $426.62. This is as traders recalibrated expectations for the AI semiconductor space following a sell-off at the end of June / early July. IBM provided its Q2 guidance July 14, where customers are said to be pivoting from spending on software to hardware / memory. This added some doubt on the pace of AI infrastructure spending (though ultimately positive to chip foundries). TSMC is up 52% year-to-date, so this is a pullback from an already large gain. Still, this is well above its 200-period EMA, as well as 2026 uptrend.
What Is CoWoS and Why Does It Matter for TSMC?
Chip-on-Wafer-on-Substrate (CoWoS) is TSMC’s advanced packaging tech that puts several chips together on a substrate, providing the high-bandwidth comms needed for AI processors with high-bandwidth memory. CoWoS is found in Nvidia's Blackwell GPUs, Google TPUs, and some other custom AI accelerators. TSMC is the key supplier of CoWoS capacity, and has seen more demand than supply since 2024. Any updates on CoWoS capacity expansion on Thursday's call are closely watched, since that will tell how many advanced chips could be shipped in H2 2026.
Bottom Line
TSMC at $426.62 is trading around the trendline and EMA support ahead of Q2 earnings tomorrow July 16. June revenue was NT$442.68 billion, 67.9% up YoY, putting H1 at 2026 $2,404.48 billion, or 35.6%. The Q2 consensus is $39.5 to $40.2 billion, and $3.83 EPS revenue is already clear from monthly numbers. Key questions going forward are gross margin performance vs the 65.5-67.5% guidance, Q3 guidance compared to full year of 30%+ growth targets and CoWoS / N2 timeline details. RSI is at 44 (neutral). Above $436.34, it targets $437.98, $447.93, and $459.41. Below $418.95, downside opens to $406.61.
Recommended Articles


