


This Is the Most Expensive Stock Market in 26 Years. Should Investors Be Worried?
Key Points
The Shiller price-to-earnings ratio (CAPE ratio) gives insight into how expensive the S&P 500 is.
The last time the CAPE ratio was this high, it was during the dot-com bubble.
The higher risk to investors is limited upside in the S&P 500 versus a dot-com bubble-like crash.
- 10 stocks we like better than S&P 500 Index ›
Since the 2022 bear market, the U.S. stock market has been on an impressive run. In the 2.5 years since then, the S&P 500 (SNPINDEX: ^GSPC) -- which many consider the stock market's most important index -- is up 97% (as of market close on July 10).
Much of this run has come at the hands of the current artificial intelligence (AI) boom and the fact that megacap tech stocks have seen their valuations skyrocket. And on the one hand, if you've been along for the ride, you've seen some good returns, no doubt about it.
Where to invest $1,000 right now? Our analyst team just revealed what they believe are the 10 best stocks to buy right now, when you join Stock Advisor. See the stocks »
On the other hand, the downside of this run-up is that the market is now the second-most expensive in history. Considering that, is now the time for investors to begin worrying?

Image source: Getty Images.
Just how expensive is the current S&P 500?
There are various ways to measure a stock or index's expensiveness, but one go-to is the Shiller price-to-earnings (P/E) ratio, sometimes known as the cyclically adjusted P/E ratio (CAPE ratio).
It's referred to as the CAPE ratio because it looks at the S&P 500's earnings over the past decade and adjusts them for inflation, giving a look into how much you're paying per $1 of those earnings. The higher the CAPE ratio, the more expensive it is, and right now it's over 41 -- a figure we haven't seen since the dot-com bubble.
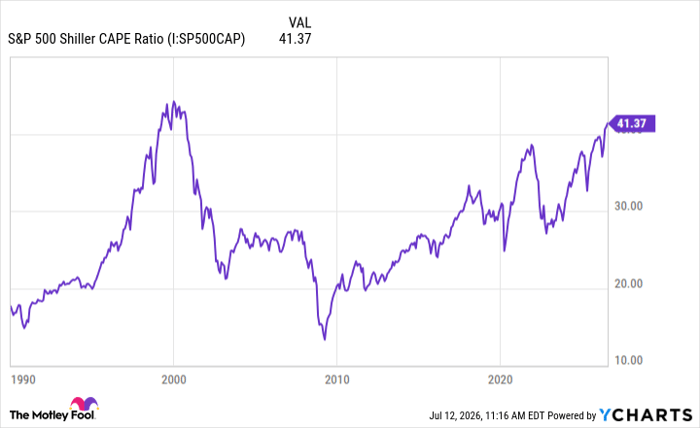
S&P 500 Shiller CAPE Ratio data by YCharts
In November 1999, the CAPE ratio peaked at just over 44. When the S&P 500 reached its peak before the historic dot-com crash in March 2000, its CAPE ratio was around 43.5. From that point until the S&P 500 bottomed out in October 2002, the index had lost almost half of its value.
Given that historical context, it's reasonable that investors would start feeling concerned as the current ratio creeps that way. The only other time in history we've dealt with a market this expensive, it didn't end so well.
Will this time be different?
The most important thing to note is that just because it has happened in the past doesn't mean it'll happen in the future. That's one of the stock market's golden rules. The CAPE ratio itself doesn't fully tell you everything you need to know; it's better when used with a bit more context.
Much of the dot-com bubble was fueled by companies selling dreams more than producing actual revenue (let alone profits). The megacap tech companies responsible for pushing the CAPE ratio to its current level -- such as the "Magnificent Seven" stocks -- are real businesses printing billions in profits. That doesn't necessarily justify their valuations, but it's a much different landscape from the dot-com crash.
This expensive market right now is worth keeping an eye on, yes, but I don't think it's at risk of a dot-com bubble, financial crisis type of crash. A correction or bear market isn't off the table, but it would be surprising to see the S&P 500 experience one of those types of rough patches.
The real problem, in my opinion, is that the expensive market (and the premium investors are paying) could now limit upside and return potential. We can't predict how the market will perform going forward, but that's more of a longer-term worry than the current valuation.
A good way to approach investing in the market
A strategy I use -- especially during times when there's a bit more market uncertainty than usual -- is dollar-cost averaging. When you dollar-cost average, you set a specific amount you can commit to an investment, put yourself on a set investment schedule, and stick to it regardless of what's happening in the market at that time.
Say you can commit $200 to an S&P 500 ETF each month. You could decide to invest $100 biweekly, $50 weekly, or a lump sum at the beginning of each month. The frequency isn't as important as making sure you choose one that's sustainable for you and your financial situation.
History has shown us that consistently investing in the S&P 500 is one of the surefire ways to build wealth over time, regardless of the inevitable volatility along the way. Sometimes, you'll invest when prices are high, and vice versa. The key is to trust the long-term trajectory.
So, yes, you should be aware of how expensive the stock market is and the increased risk that comes with that. However, that shouldn't deter you from investing and putting your money to work.
Should you buy stock in S&P 500 Index right now?
Before you buy stock in S&P 500 Index, consider this:
The Motley Fool Stock Advisor analyst team just identified what they believe are the 10 best stocks for investors to buy now… and S&P 500 Index wasn’t one of them. The 10 stocks that made the cut could produce monster returns in the coming years.
Consider when Netflix made this list on December 17, 2004... if you invested $1,000 at the time of our recommendation, you’d have $398,160!* Or when Nvidia made this list on April 15, 2005... if you invested $1,000 at the time of our recommendation, you’d have $1,249,202!*
Now, it’s worth noting Stock Advisor’s total average return is 918% — a market-crushing outperformance compared to 209% for the S&P 500. Don't miss the latest top 10 list, available with Stock Advisor, and join an investing community built by individual investors for individual investors.
See the 10 stocks »
*Stock Advisor returns as of July 15, 2026.
Stefon Walters has no position in any of the stocks mentioned. The Motley Fool has no position in any of the stocks mentioned. The Motley Fool has a disclosure policy.
Recommended Articles


