


Meta Stock Price Forecast: Heavy Upside Pressure on Stock Price, Can It Still Rise in the Second Half of 2026?
TradingKey - As of July 9, Eastern Time, Meta ( META )'s latest stock price was $631.48, up 4.7% intraday, touching an intraday high of $633.27. Meta's stock price reclaimed the $600 mark, but technicals still suggest the possibility of a continued pullback.
Meta Advertising Business Strong, AI Capital Expenditure Becomes Biggest Disagreement
From a fundamental perspective, the company's first-quarter revenue reached $56.311 billion, up 33% year-over-year; net income was $26.773 billion, up 61% year-over-year; and diluted EPS was $10.44, compared with $6.43 in the same period last year. Advertising remains Meta's core cash cow, with first-quarter ad revenue reaching $55.024 billion, up 33% year-over-year. Ad impressions grew 19% year-over-year, and the average price per ad increased 12% year-over-year, indicating that Meta is not only continuing to expand its traffic, but is also improving its ad pricing power.
More importantly, Meta's second-quarter guidance remains strong. The company expects total second-quarter revenue to be between $58 billion and $61 billion, indicating that advertising demand and improvements in AI recommendation efficiency are still expected to continue supporting revenue growth.
Strong financial results and guidance have prompted institutions to collectively turn bullish on Meta. Wells Fargo recently raised Meta's price target to $767, primarily because advertising growth remains robust. Morgan Stanley maintained its $775 price target and considers Meta a key allocation choice among mega-cap tech stocks, believing that market concerns over the return on investment of AI spending have already been reflected in the stock price. Although Goldman Sachs slightly lowered its price target from $840 to $830 after the earnings release, it maintained its Buy rating, indicating that its core outlook has not turned pessimistic. Analyst data compiled by MarketBeat shows that Meta's average 12-month price target is approximately $840.64, representing substantial upside potential from the current share price, with the highest price target reaching $1,015.
However, the market's biggest debate over Meta currently lies in its heavy AI spending, which is pressuring short-term free cash flow. The company expects capital expenditures to reach $125 billion to $145 billion in 2026, higher than previously estimated, primarily for data centers, servers, and AI model training and inference infrastructure. For bulls, Meta's massive AI investment can enhance ad recommendation efficiency, content distribution efficiency, and user retention, ultimately translating into higher advertising revenue. For bears, such spending is difficult to justify in terms of return on investment in the short term.
Meanwhile, recent reports that Meta might sell or lease its surplus computing power have attracted market attention. If Meta can monetize part of its AI infrastructure through cloud computing or enterprise service revenue, it would help ease market concerns over capital expenditures. However, this also raises new questions: Is Meta truly strengthening its AI platform capabilities, or is it forced to seek monetization routes because its front-loaded investment in computing power was too large? Therefore, in upcoming earnings reports, investors will need to focus on whether AI spending is actually improving advertising efficiency and whether management provides a clearer commercialization path for its computing power.
Meta Stock Price Trend Analysis: Key Resistance Level at $650, Support at $520
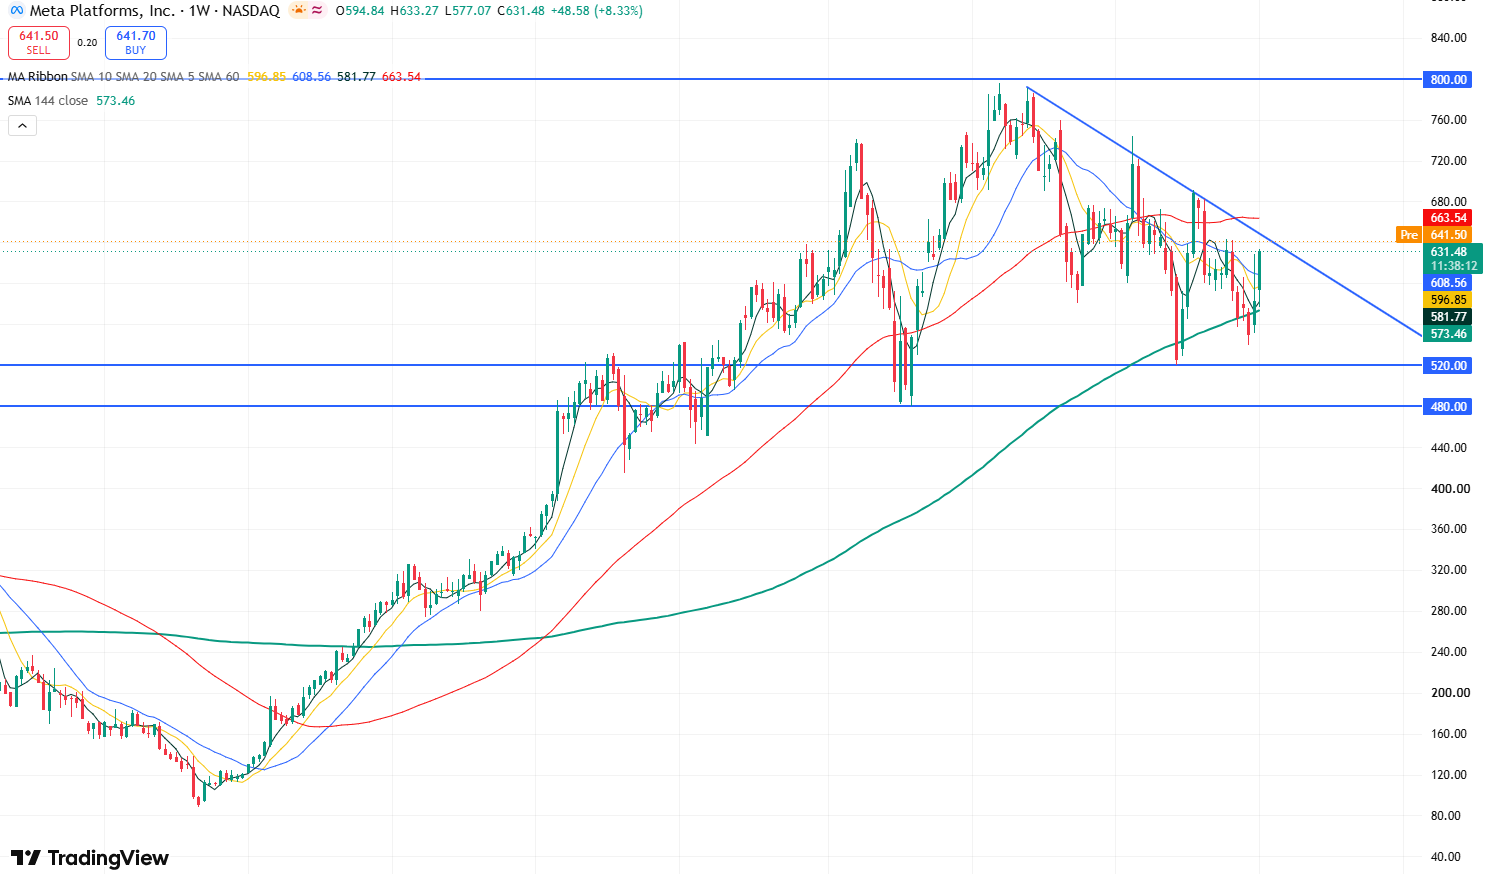
Meta weekly stock chart, Source: TradingView
Looking at Meta's weekly stock chart, the stock price exhibited a strong bullish trend from October 2022 to September 2025. However, since the beginning of this year, the stock has entered a wide-ranging consolidation and correction phase. Meanwhile, as the candlestick highs and lows continue to move lower, connecting the candlestick highs forms a clear downward trendline, indicating that the short-term trend of the stock price is biased to the downside.
From the perspective of the moving average system, as the stock price has fallen below the SMA144 moving average twice consecutively, the market's bearish momentum has been further strengthened, suggesting the stock price may continue to correct downward.
Currently, attention should be paid to the key resistance level overhead near the downward trendline, which is around $650. If the stock price can effectively break out and stabilize above the downward trendline, it will open up upside room toward the important resistance level of $800. Conversely, if the stock price remains under pressure below $650, it may continue to correct downward, with the primary support level below situated near $520. If the stock price breaks below this level, it may further correct toward the key support level of $480, and if it fails to hold $480, the stock price could undergo a deeper correction toward the $430 support level.
Recommended Articles


