

Warren Buffett Just Sent Investors an 11-Word Warning About the Stock Market. History Says He's Right.
Key Points
The future of the market is uncertain, which can be daunting for investors.
Overvalued stocks and short-term investments are particularly risky right now.
Protecting your portfolio against volatility is simpler than you might think.
- 10 stocks we like better than S&P 500 Index ›
After record-breaking growth so far this year, the S&P 500 (SNPINDEX: ^GSPC), Nasdaq Composite (NASDAQINDEX: ^IXIC), and Dow Jones Industrial Average (DJINDICES: ^DJI) have wobbled over the past few weeks -- and many investors are feeling conflicted about what's coming next.
Around 45% of U.S. investors are optimistic about the market's next six months, according to a June 2026 survey from the American Association of Individual Investors, compared with 36% who are pessimistic and 19% who are neutral.
Where to invest $1,000 right now? Our analyst team just revealed what they believe are the 10 best stocks to buy right now, when you join Stock Advisor. See the stocks »
At the same time, however, CNN's Fear and Greed Index -- which measures investor sentiment based on a variety of stock market indicators -- has been firmly in the "fear" category for most of June.
Even Wall Street experts can't agree on whether we're in an AI bubble or if the market still has plenty of growth potential ahead. While even investing legend Warren Buffett can't predict the future, he recently offered a few words of warning -- and history says investors should pay attention.

Image source: The Motley Fool.
Investors may be taking on unnecessary risk
In an interview with CNBC during Berkshire Hathaway's annual meeting earlier this year, Buffett said he often likens the stock market to a church with a casino attached. While the church represents his long-term investment philosophy, the casino represents those who take short-term gambles on risky stocks.
He also issued a warning, noting that "we've never had people in a more gambling mood than now," as more investors gravitate toward risky short-term investments.
History suggests Buffett is correct. Overvalued stocks may surge in the short term if they get enough hype, but those prices typically aren't sustainable for the long haul. Buying these stocks at record-high prices could be incredibly risky, as they're often hit the hardest during a bear market or recession.
During the dot-com bubble, for instance, hundreds of tech companies reached new heights before collapsing during the following bear market. Despite their soaring stock prices, these companies lacked solid foundations to fall back on, and many didn't survive the bursting of the bubble.
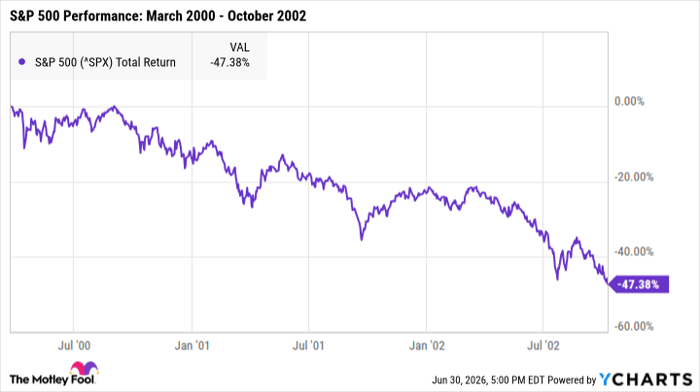
^SPX data by YCharts
Concerns are growing that the market is overvalued right now, and Buffett's favorite market indicator is also raising red flags.
Nicknamed the Buffett indicator after he used it to predict the bursting of the dot-com bubble, this metric measures the relationship between the total value of U.S. stocks and GDP. A higher ratio suggests the market may be overvalued, and in a 2001 interview with Fortune magazine, Buffett noted that investors are "playing with fire" when it nears 200%.
As of this writing, the Buffett indicator has surpassed 233%, the highest level on record.
What investors can do right now
No market indicator is perfect, so there are no guarantees that a downturn is around the corner. That said, it never hurts to prepare, and there are two key moves investors can make to protect their portfolios: Invest in quality businesses with robust fundamentals, and stay invested through the market's rough patches.
Companies with sound foundations -- such as a sustainable business model and a competent leadership team -- are most likely to thrive over time. The best stocks are also either undervalued or fairly priced, as overvalued stocks tend to underperform the market.
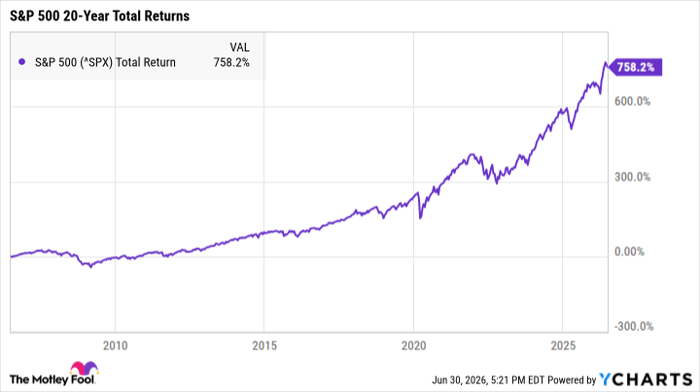
^SPX data by YCharts
Second, a long-term outlook is key. Buffett has long emphasized a buy-and-hold strategy, famously stating that his ideal holding period for healthy stocks is "forever." The S&P 500 has earned total returns of more than 758% over the last 20 years (through the first half of 2026), proving that time in the market is far more valuable than timing the market.
Nobody, not even Warren Buffett, can say where the market will be in a year or two. But with many stocks overvalued right now, investing in quality companies with long-term growth potential will be key to surviving any potential turbulence.
Should you buy stock in S&P 500 Index right now?
Before you buy stock in S&P 500 Index, consider this:
The Motley Fool Stock Advisor analyst team just identified what they believe are the 10 best stocks for investors to buy now… and S&P 500 Index wasn’t one of them. The 10 stocks that made the cut could produce monster returns in the coming years.
Consider when Netflix made this list on December 17, 2004... if you invested $1,000 at the time of our recommendation, you’d have $418,761!* Or when Nvidia made this list on April 15, 2005... if you invested $1,000 at the time of our recommendation, you’d have $1,195,804!*
Now, it’s worth noting Stock Advisor’s total average return is 918% — a market-crushing outperformance compared to 208% for the S&P 500. Don't miss the latest top 10 list, available with Stock Advisor, and join an investing community built by individual investors for individual investors.
See the 10 stocks »
*Stock Advisor returns as of July 4, 2026.
Katie Brockman has no position in any of the stocks mentioned. The Motley Fool has positions in and recommends Berkshire Hathaway. The Motley Fool has a disclosure policy.
Recommended Articles


