


US Dollar Index storms back as the Fed turns hawkish
- DXY surged to a session high after the June Federal Reserve decision.
- New projections flipped the 2026 rate path from a cut to a hike bias.
The Federal Reserve (Fed) held the federal funds rate at 3.50% to 3.75% on Wednesday, but Kevin Warsh's first meeting as Chair was anything but a placeholder. The Federal Open Market Committee (FOMC) backed the hold unanimously, 12 to 0, a stark change from the four-way 8 to 4 split in April, and the statement stripped out its easing bias. The reference to the timing of future moves disappeared, replaced by a flat pledge to restore price stability.
The updated Summary of Economic Projections (SEP) carried the punch. The median 2026 federal funds projection climbed to roughly 3.8% from 3.4% in March, turning the signal from a cut into a hike bias. The cause was inflation: the median 2026 Personal Consumption Expenditures (PCE) forecast vaulted to 3.6% from 2.7%, with the core reading lifted to 3.3%. After months of cut talk, the Fed has thrown in with the hawks.
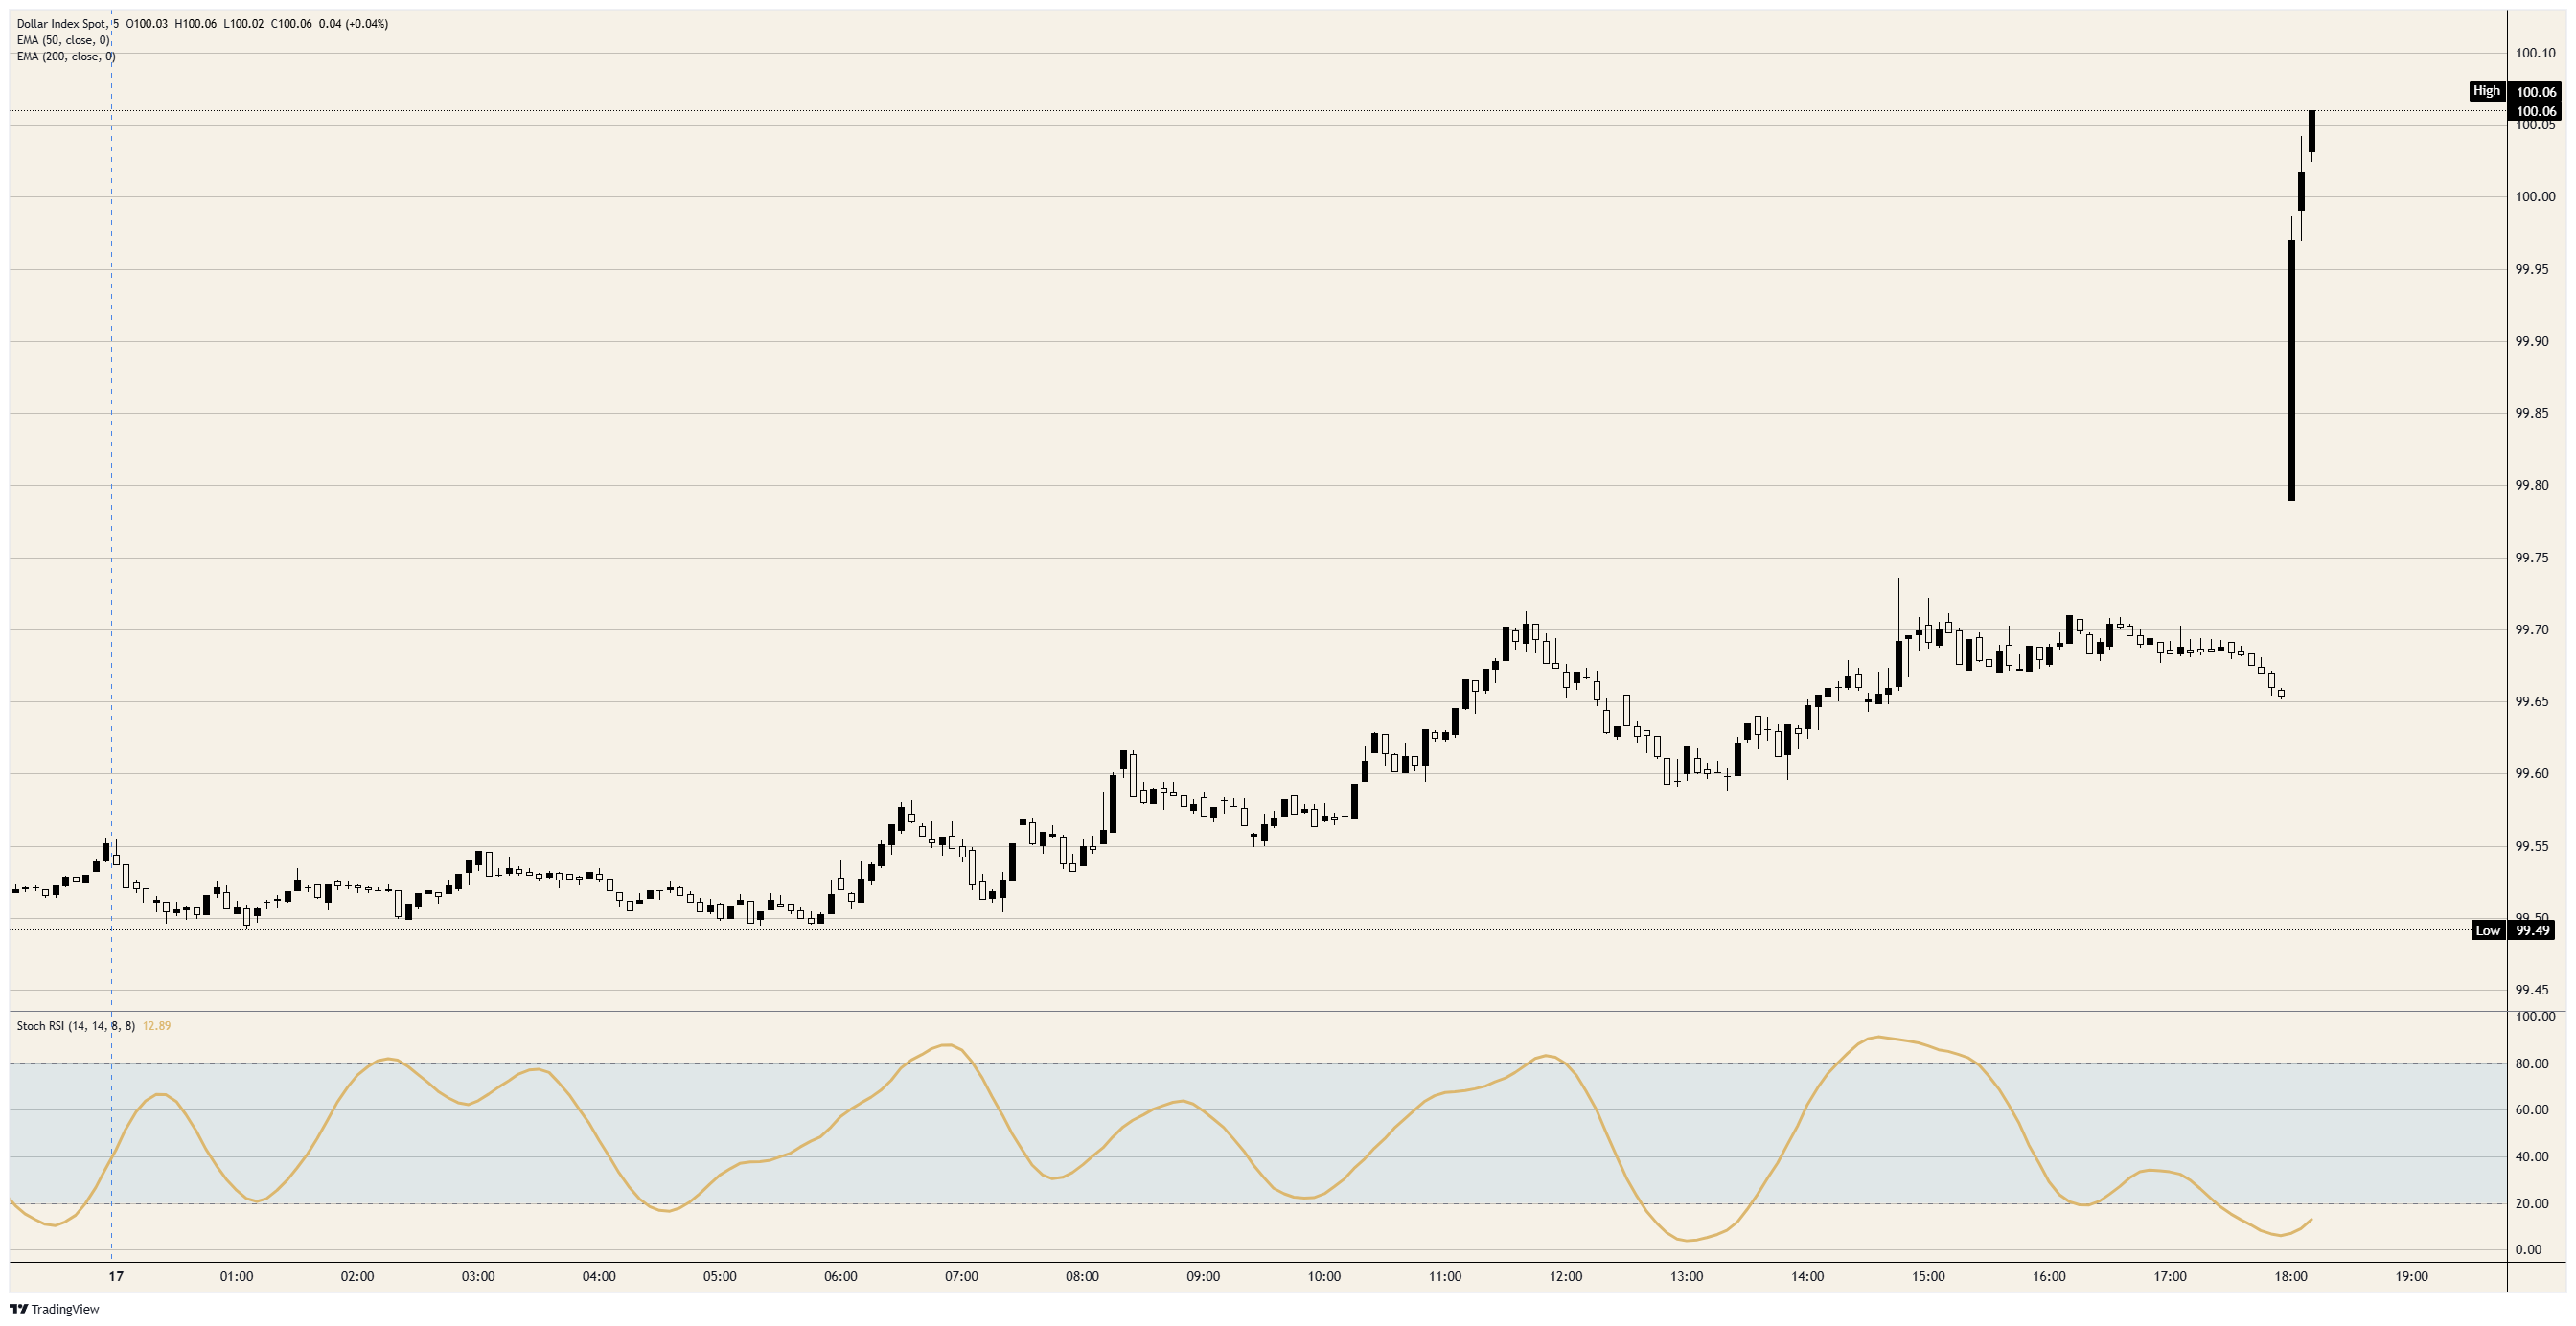
The US Dollar Index (DXY) ripped higher on the release, spiking through the 100.00 handle to a session high just above it after hovering in the high 99.60s into the decision.
The bias is bullish while DXY holds above 100.00, with 100.50 and then 101.00 the upside markers; a slip back beneath 100.00 would call the breakout into question. Focus shifts to Warsh's first press conference as Chair at 18:30 GMT, the first read on how firmly he intends to defend the hawkish dots.
US Dollar Index 5-minute chart
Dot Plot FAQs
The “Dot Plot” is the popular name of the interest-rate projections by the Federal Open Market Committee (FOMC) of the US Federal Reserve (Fed), which implements monetary policy. These are published in the Summary of Economic Projections, a report in which FOMC members also release their individual projections on economic growth, the unemployment rate and inflation for the current year and the next few ones. The document consists of a chart plotting interest-rate projections, with each FOMC member’s forecast represented by a dot. The Fed also adds a table summarizing the range of forecasts and the median for each indicator. This makes it easier for market participants to see how policymakers expect the US economy to perform in the near, medium and long term.
The US Federal Reserve publishes the “Dot Plot” once every other meeting, or in four of the eight yearly scheduled meetings. The Summary of Economic Projections report is published along with the monetary policy decision.
The “Dot Plot” gives a comprehensive insight into the expectations from Federal Reserve (Fed) policymakers. As projections reflect each official’s projection for interest rates at the end of each year, it is considered a key forward-looking indicator. By looking at the “Dot Plot” and comparing the data to current interest-rate levels, market participants can see where policymakers expect rates to head to and the overall direction of monetary policy. As projections are released quarterly, the “Dot Plot” is widely used as a guide to figure out the terminal rate and the possible timing of a policy pivot.
The most market-moving data in the “Dot Plot” is the projection of the federal funds rate. Any change compared with previous projections is likely to influence the US Dollar (USD) valuation. Generally, if the “Dot Plot” shows that policymakers expect higher interest rates in the near term, this tends to be bullish for USD. Likewise, if projections point to lower rates ahead, the USD is likely to weaken.
Recommended Articles


