


Ethereum Price Forecast: ETH recovers $2,500 amid BitMine accumulation and ETF outperformance
Ethereum price today: $2,540
- BitMine scooped 27,180 ETH last week even as Canaan sold off its entire 3,952 ETH position.
- Bitfinex analysts note that Ethereum ETFs' outperformance last week may not be due to pure directional positioning.
- ETH retests the $2,544 resistance after posting a golden cross.
Ethereum (ETH) holds steady near $2,500 on Monday as digital asset firms BitMine Immersion (BMNR) and Canaan followed opposite paths in their treasury strategy.
BitMine continued its weekly accumulation of the top altcoin, scooping 27,180 ETH last week. The move has pushed its stash to 5.95 million ETH, representing roughly 4.9% of the 122 million ETH circulating supply.
From its holdings, the Las Vegas-based firm is also contributing to Ethereum's security and chasing yield with a 5.067 million ETH stake via its Made in America Validator Network (MAVAN). The funds are projected to earn $334 million in annualized staking revenue.
BitMine also reported holdings of 212 Bitcoin (BTC), a $180 million stake in Beast Industries, $98 million worth of Eightco Holdings shares (ORBS) and total cash and marketable securities of $549 million.
While BitMine accumulated, crypto mining chip manufacturer Canaan sold off its entire Ethereum holdings of 3,952 ETH, along with 54 BTC, for $13.9 million. The company sold at an average price of $2,400 per ETH and $79,000 per BTC, noting it capitalized on the recent crypto market recovery.
Canaan said it used the proceeds to buy back an additional 13.6 million American Depositary Shares (ADSs), bringing total repurchased shares since the beginning of the year to 16.4 million. The company held 1,868 BTC at the end of August.
ETH ETFs outperform BTC products, but it may not be due to directional bets
Meanwhile, US spot ETH exchange-traded funds (ETFs) saw $197.1 million in net inflows last week, dominating their BTC ETF counterparts, which recorded $462.7 million in net outflows, according to SoSoValue data.
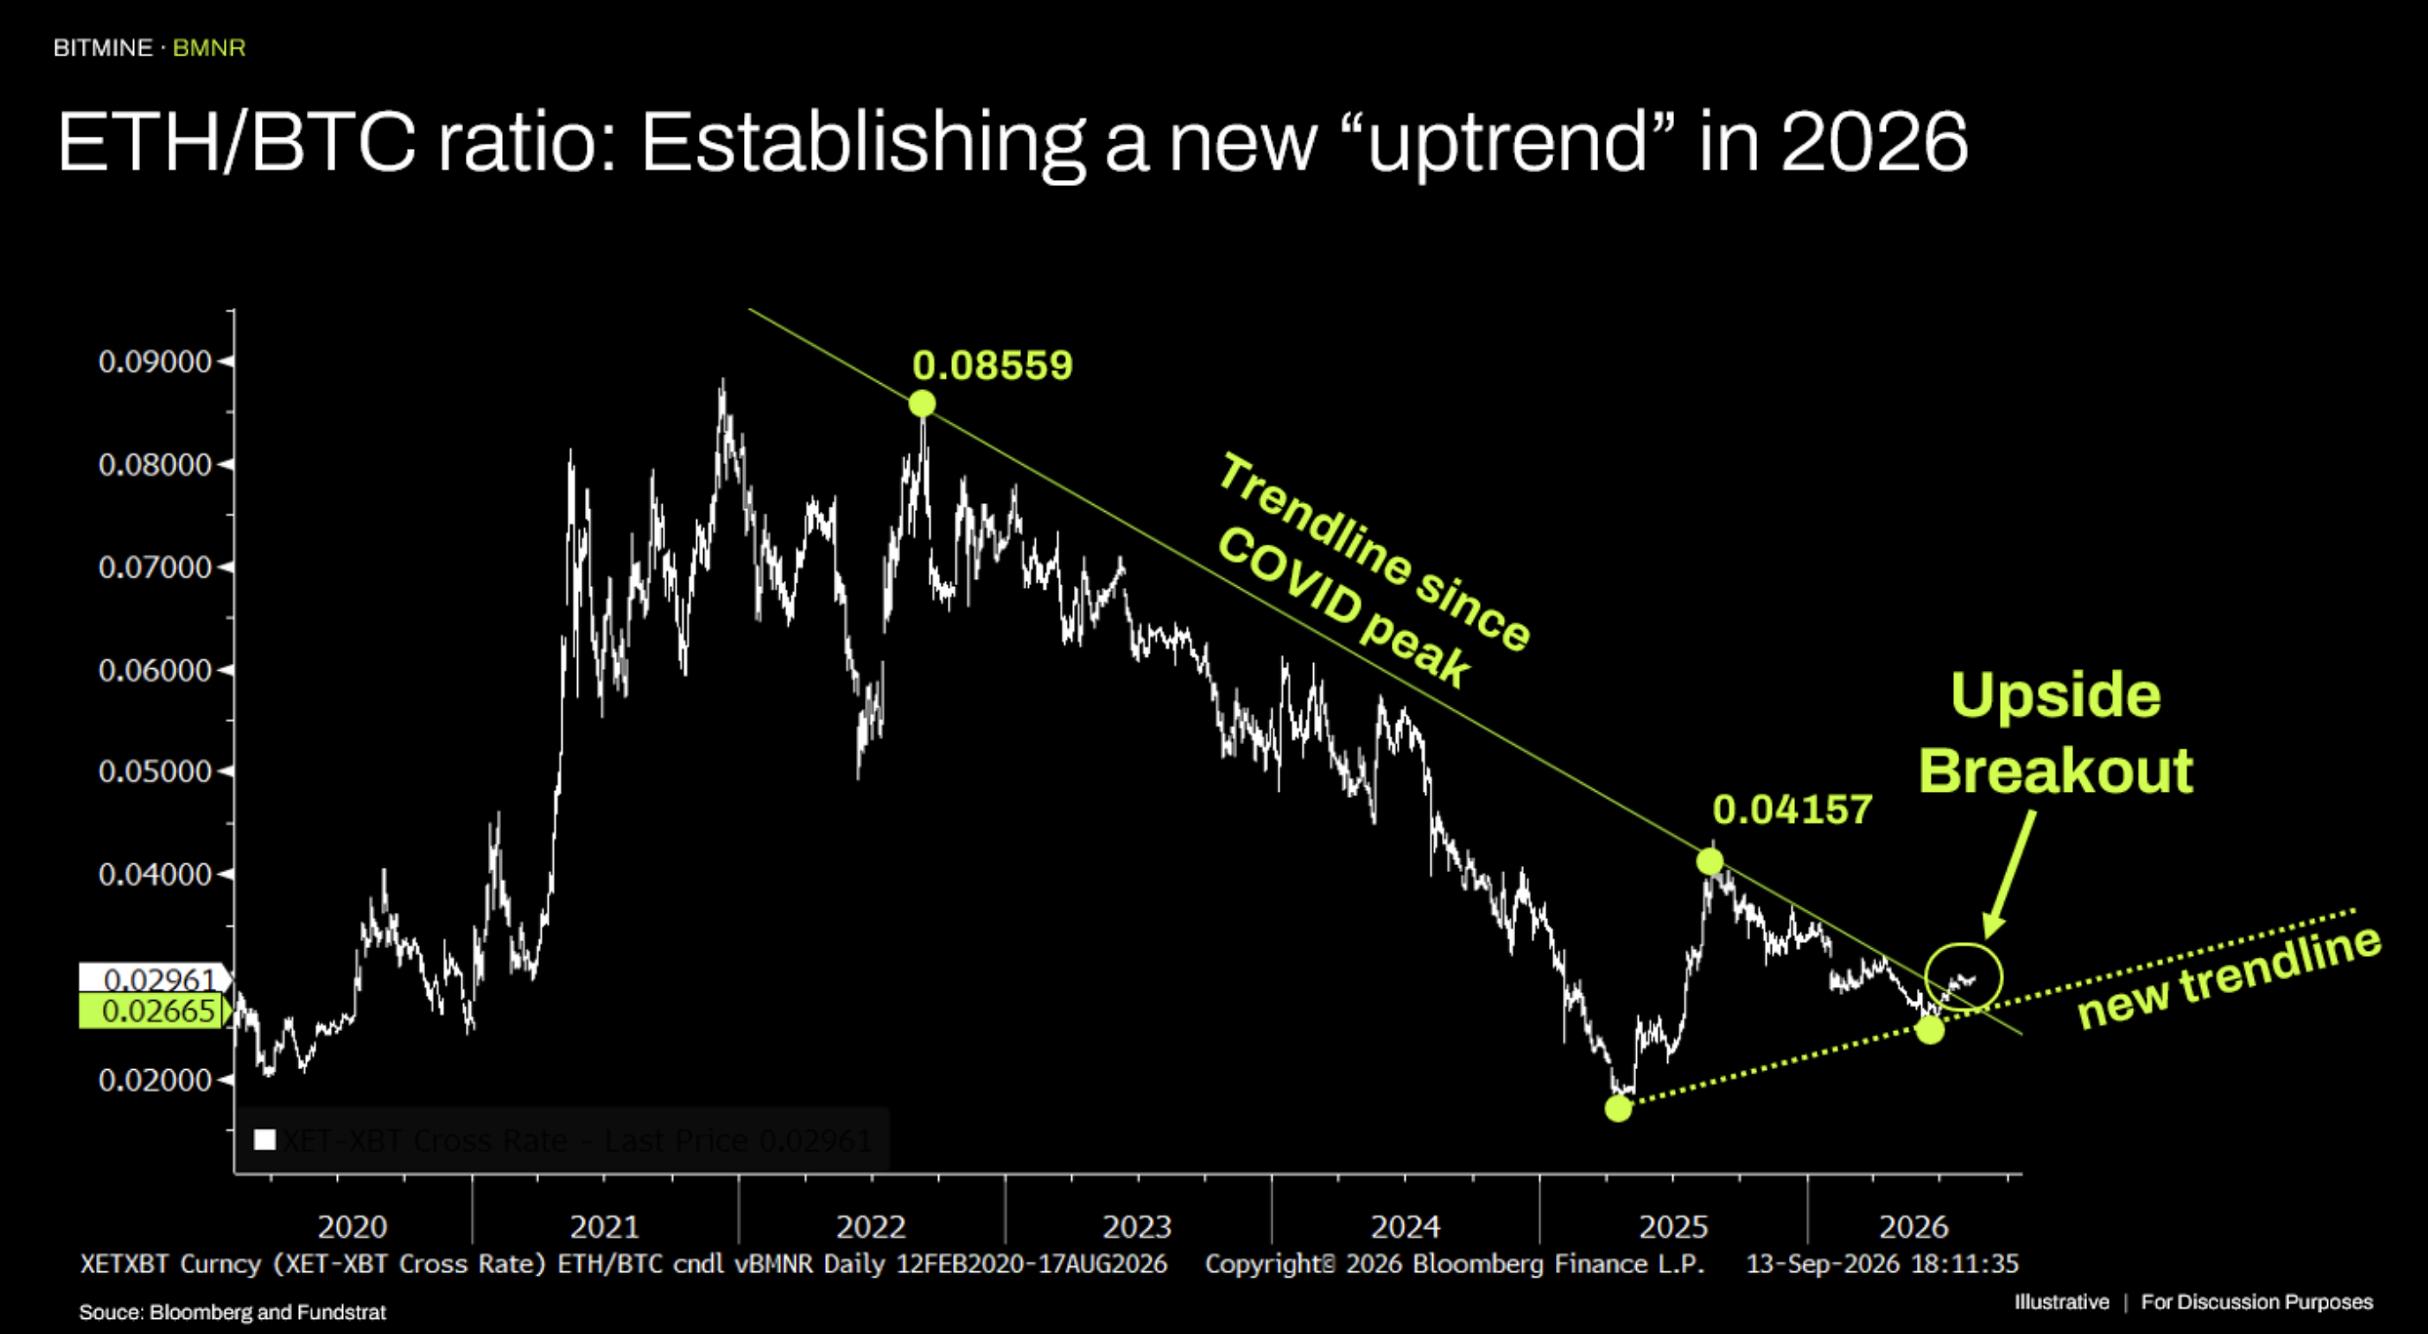
"The price ratio of ETH to BTC moved to the highest level since Jan 30th of this year and established a new uptrend, breaking the trendline in place since the COVID-19 highs," wrote BitMine Chairman Thomas Lee in a Monday statement. "In our view, this reflects Ethereum's strengthened position as the settlement rails for Wall Street tokenization and the increased realization that Ethereum may play a critical central role in managing agentic-AI."
However, Bitfinex analysts hold an alternative view, attributing ETH's recent outperformance to a "cash and carry" strategy rather than a pure directional bet.
"Traders are building ETH ETF positions to use as collateral to trade CME futures, while earning yield,” the analysts wrote in a note to investors on Monday. "It explains the more robust interest in Ether ETF products relative to Bitcoin ETFs since they provide a higher basis rate and a potential yield from Ether staking."
Bitfinex analysts added that their view is supported by the accompanying $255 million ETH short squeeze last Friday, which surpassed Bitcoin's $172 million short liquidations despite having a larger open interest.
"That makes the Ether bid more of a positioning event, rather than a reallocation until we see more evidence of spot buying without a short-squeeze backdrop," the analysts added.
Ethereum Price Forecast: ETH retests $2,544 resistance after golden cross signal
Ethereum has seen $45.3 million in liquidations over the past 24 hours, led by $22.7 million in long liquidations.
On the daily chart, ETH is extending its advance above a dense layer of Exponential Moving Average (EMA) support. The 20-day EMA at $2,441 underpins the immediate bullish tone, reinforced by the 50- and 200-day EMAs, which are about to post a golden cross. The move signifies that short-term buying is outweighing the earlier long-term downtrend.
Momentum stays constructive, with the 14-day Relative Strength Index (RSI) hovering near 63 and the Stochastic Oscillator (Stoch) around 59, suggesting positive but not extreme buying pressure as price grinds higher within the recent uptrend.
On the topside, ETH is testing the $2,544 initial resistance at the nearby horizontal barrier, followed by stronger supply at $2,626 and then $2,786.
On the downside, the first meaningful support is the 20-day EMA at $2,441, closely backed by the horizontal level at $2,431. A deeper pullback would expose the EMA cluster around $2,265 and the mid-range floor at $2,172, backed by the 100-day EMA below it.
As long as ETH holds above the $2,430 area, bulls could continue probing the $2,625 region, while a daily close below that zone would hint at a broader consolidation toward the lower supports.
(The technical analysis of this story was written with the help of an AI tool. Know more.)
Recommended Articles


