


Zcash Price Forecast: ZEC tests $500 threshold amid risks of a deeper correction
- Zcash hovers around $500 on Friday, holding steady after five consecutive days of losses.
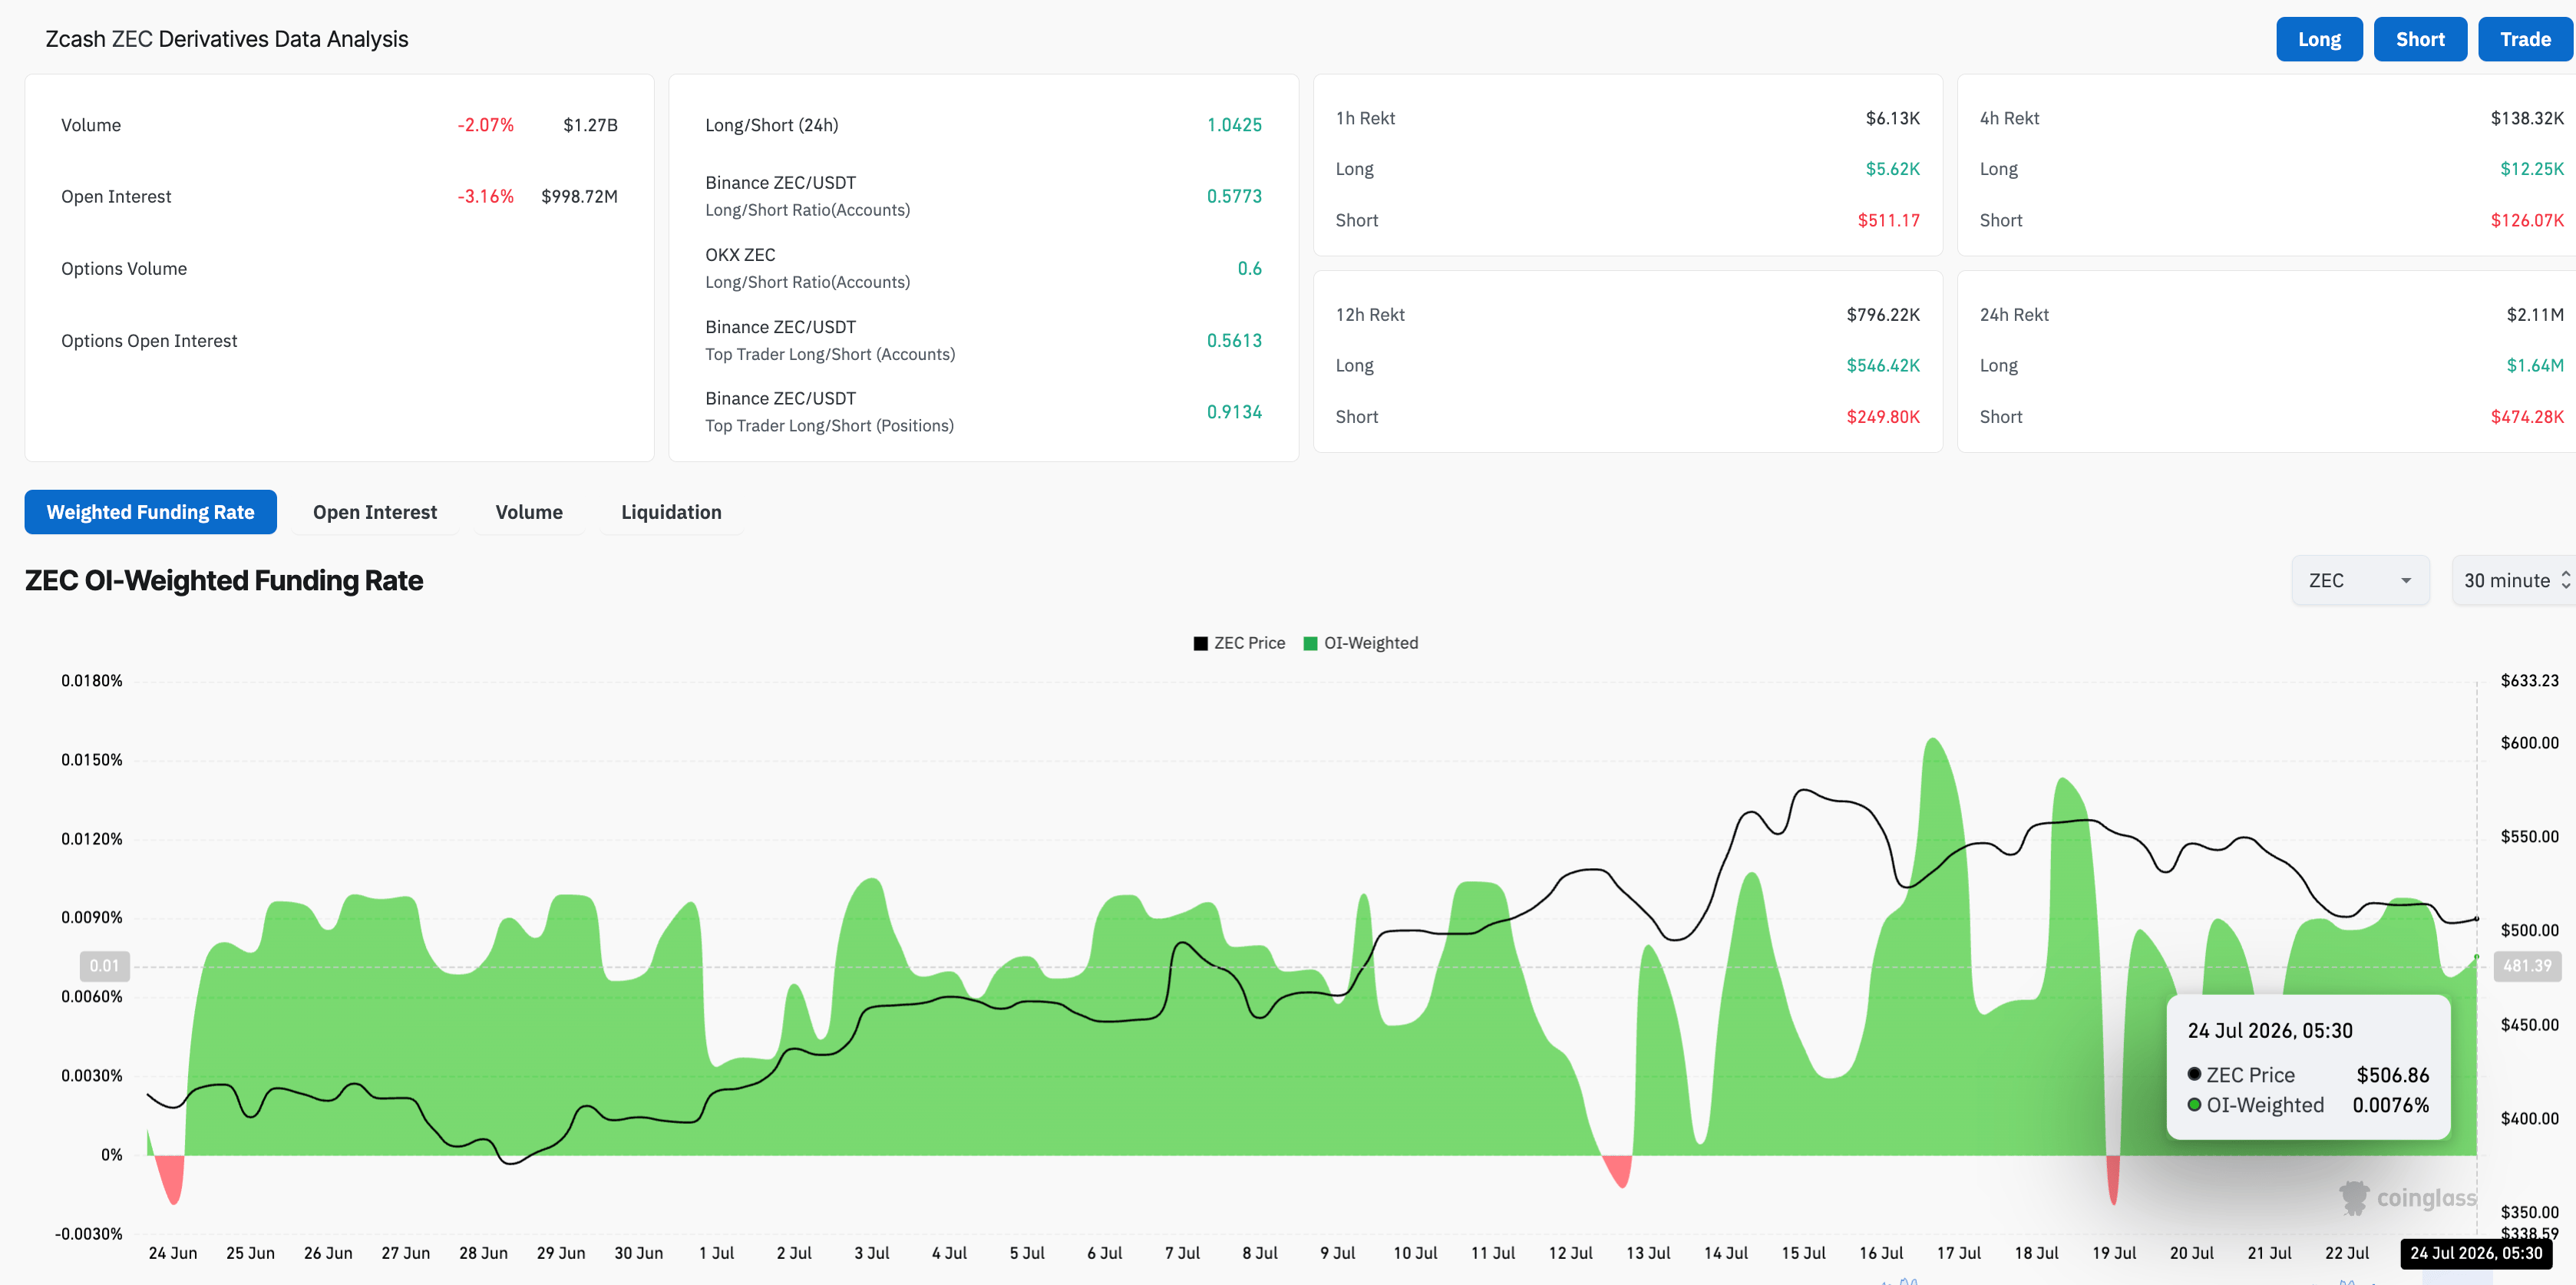
- Retail demand holds firm with neutral positional buildup and a positive funding rate despite elevated long liquidations.
- The technical outlook for ZEC highlights easing bullish momentum.
Zcash (ZEC) price hovers around $500 on Friday after five consecutive days of losses, testing a crucial support cluster. The privacy coin holds retail strength, with a positive funding rate despite over $2 million in liquidations over the last 24 hours, suggesting bullish bias persists. Technically, the easing bullish momentum risks a steeper decline below its 50-day Exponential Moving Average (EMA) around $489.
Retail demand in limbo
Zcash derivatives witnesses firm retail demand despite a bullish positional wipeout. CoinGlass data shows a positive funding rate of 0.0076% on Friday, reflecting steady demand among traders to buy long positions at a premium despite a contraction in Open Interest (OI) and trading volume.
ZEC futures OI is down 3% over the last 24 hours to $998.72 million, with a 2% decline in trading volume to $1.27 billion, together suggesting an easing notional value of active positions as price drops and reduced retail activity.
However, the long liquidations of $1.64 million outpace short liquidations of $474,280 over the last 24 hours, indicating that bullish traders are facing margin calls. Despite the positional wipeout, the long-to-short ratio of 1.0245 suggests nearly equal active long and short contracts, although their weightings may differ.
Will ZEC price hold above $500?
Zcash tests a local support trendline near $500 on Friday, supported by the 50-day EMA at $489 and sits well over the 200-day EMA at $408. The privacy coin also trades above the 50% retracement of the recent downswing from $690 to $250, at $470, suggesting the broader uptrend is still intact despite the recent pullback.
From a technical perspective, Zcash is poised for a deeper correction below the $500 psychological mark. A sustained close below the 50-day EMA at $489 and 50% retracement at $470 could extend the decline to the 200-day EMA at $408.
That said, the Relative Strength Index (RSI) at 51 shows a downward trend toward the neutral midline as buying pressure wanes. At the same time, the Moving Average Convergence Divergence (MACD) crosses below its signal, hinting at renewed bearish pressure.
On the topside, immediate resistance emerges at the 78.6% Fibonacci retracement around $595, reinforced by the overhead trendline near $600. A sustained break above this level would open the way toward the prior swing high area near $690.
(The technical analysis of this story was written with the help of an AI tool. Know more.)
Recommended Articles


