


Dogecoin Price Forecast: DOGE eyes $0.065 after breaking key support level
- Dogecoin trades below $0.0700 on Friday following a 5% decline the previous day.
- Bearish derivatives data signals a sell-side dominance among traders.
- The technical outlook for DOGE is bearish, with a breakout of the $0.0700 support level setting the stage for a steeper decline.
Dogecoin (DOGE) price trades in the red below $0.0700 on Friday, following a 5% drop the previous day. DOGE loses retail strength as broader market speculative demand eases with elevated tensions between the US and Iran. The technical outlook for DOGE points to deeper losses below $0.065.
Dogecoin takes the fall as broader market risk appetite wanes
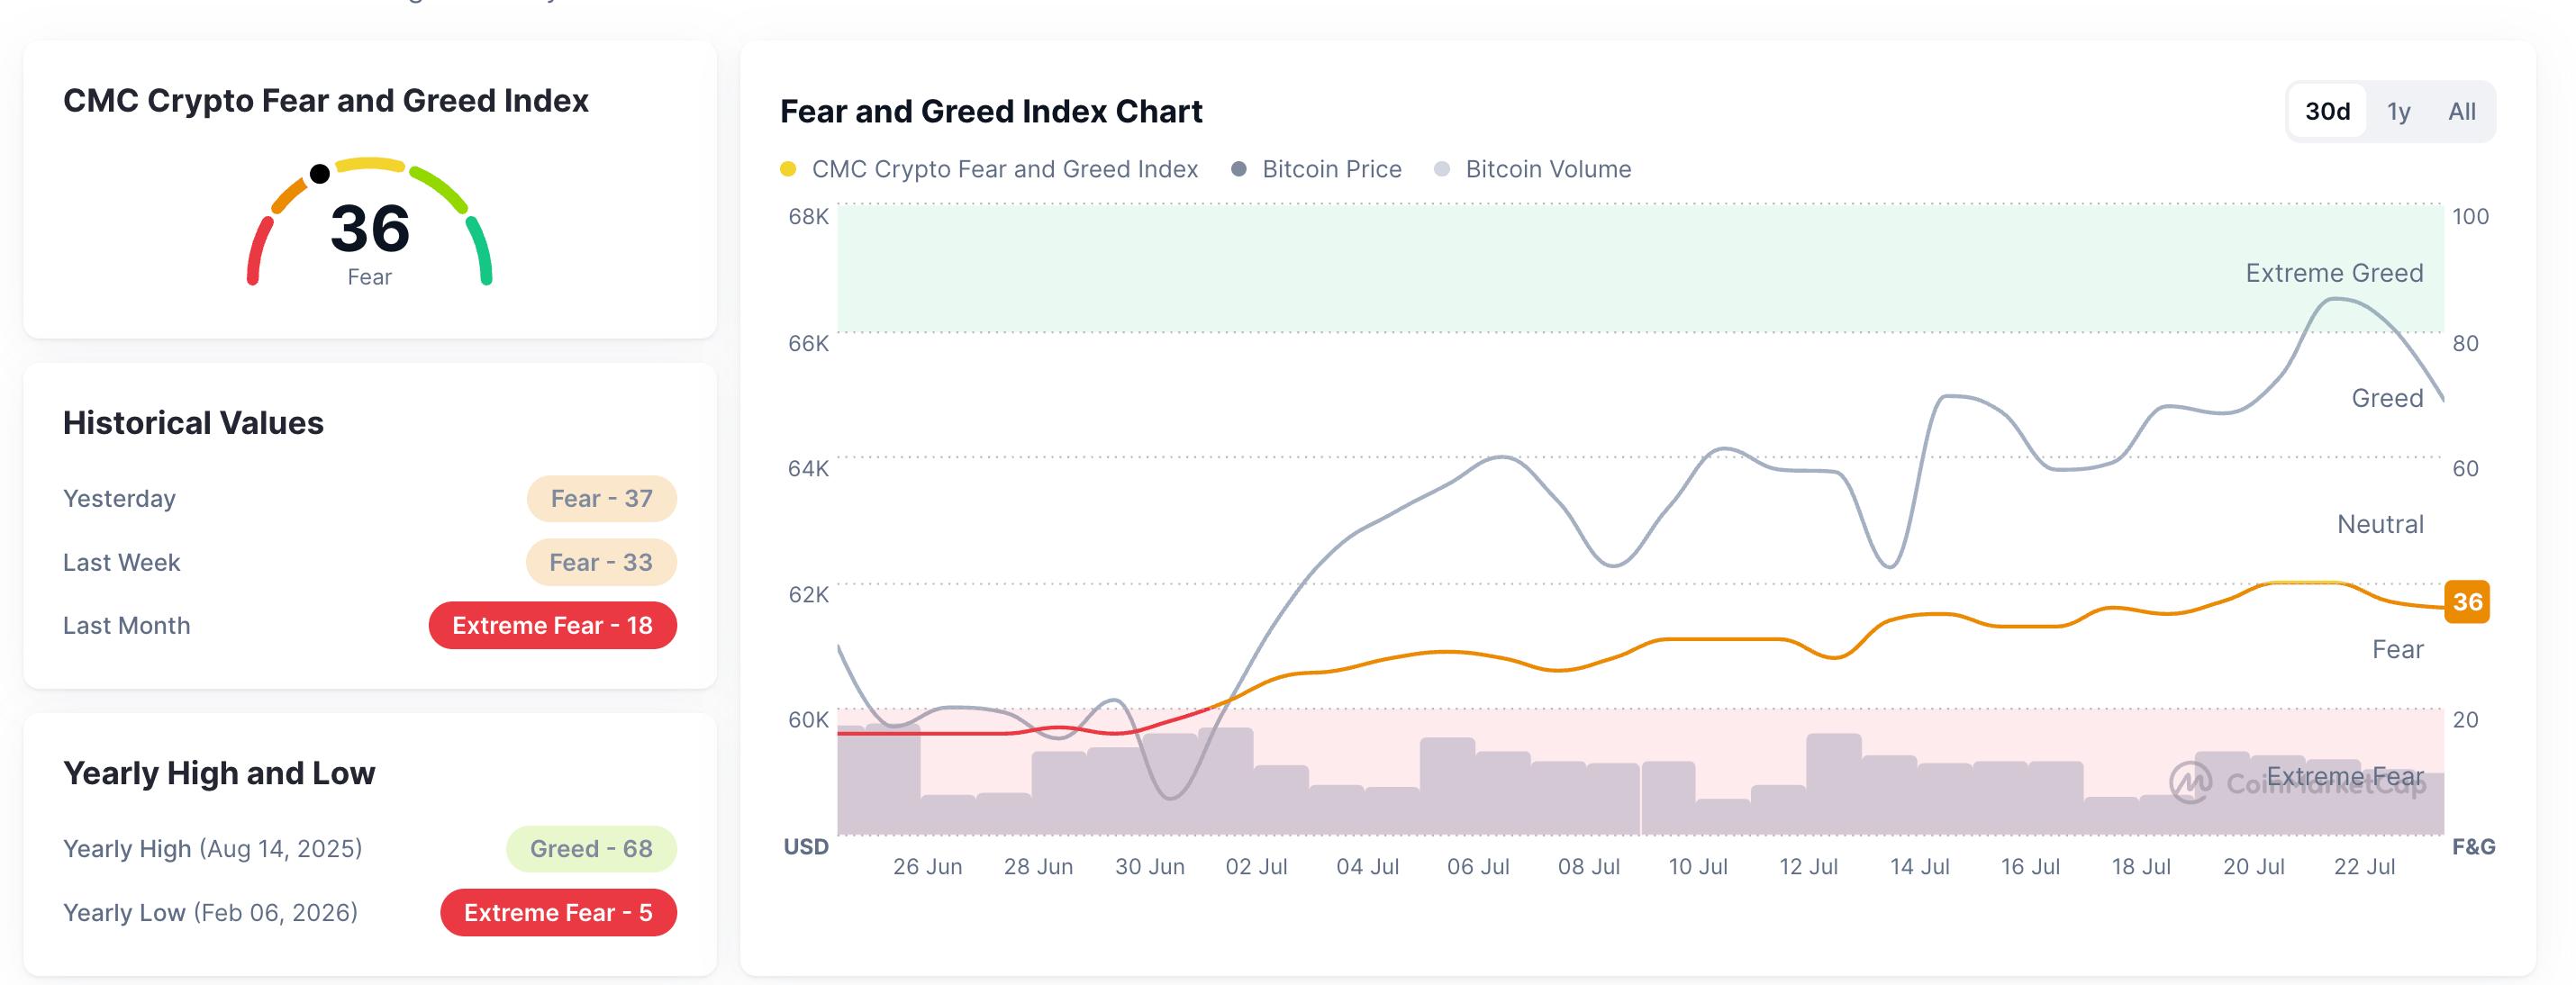
Dogecoin, the largest meme coin with a valuation of over $11 billion, shows strong correlation with broader market sentiment, with speculative demand as the key bullish catalyst. The ongoing US-Iran war and President Donald Trump’s threat of a “major military punishment” for Iran have elevated fear in the crypto market. CoinMarketCap’s Fear and Greed Index stands at 37 on Friday, down from 40 on Wednesday, reflecting sentiments returning to bearish levels.
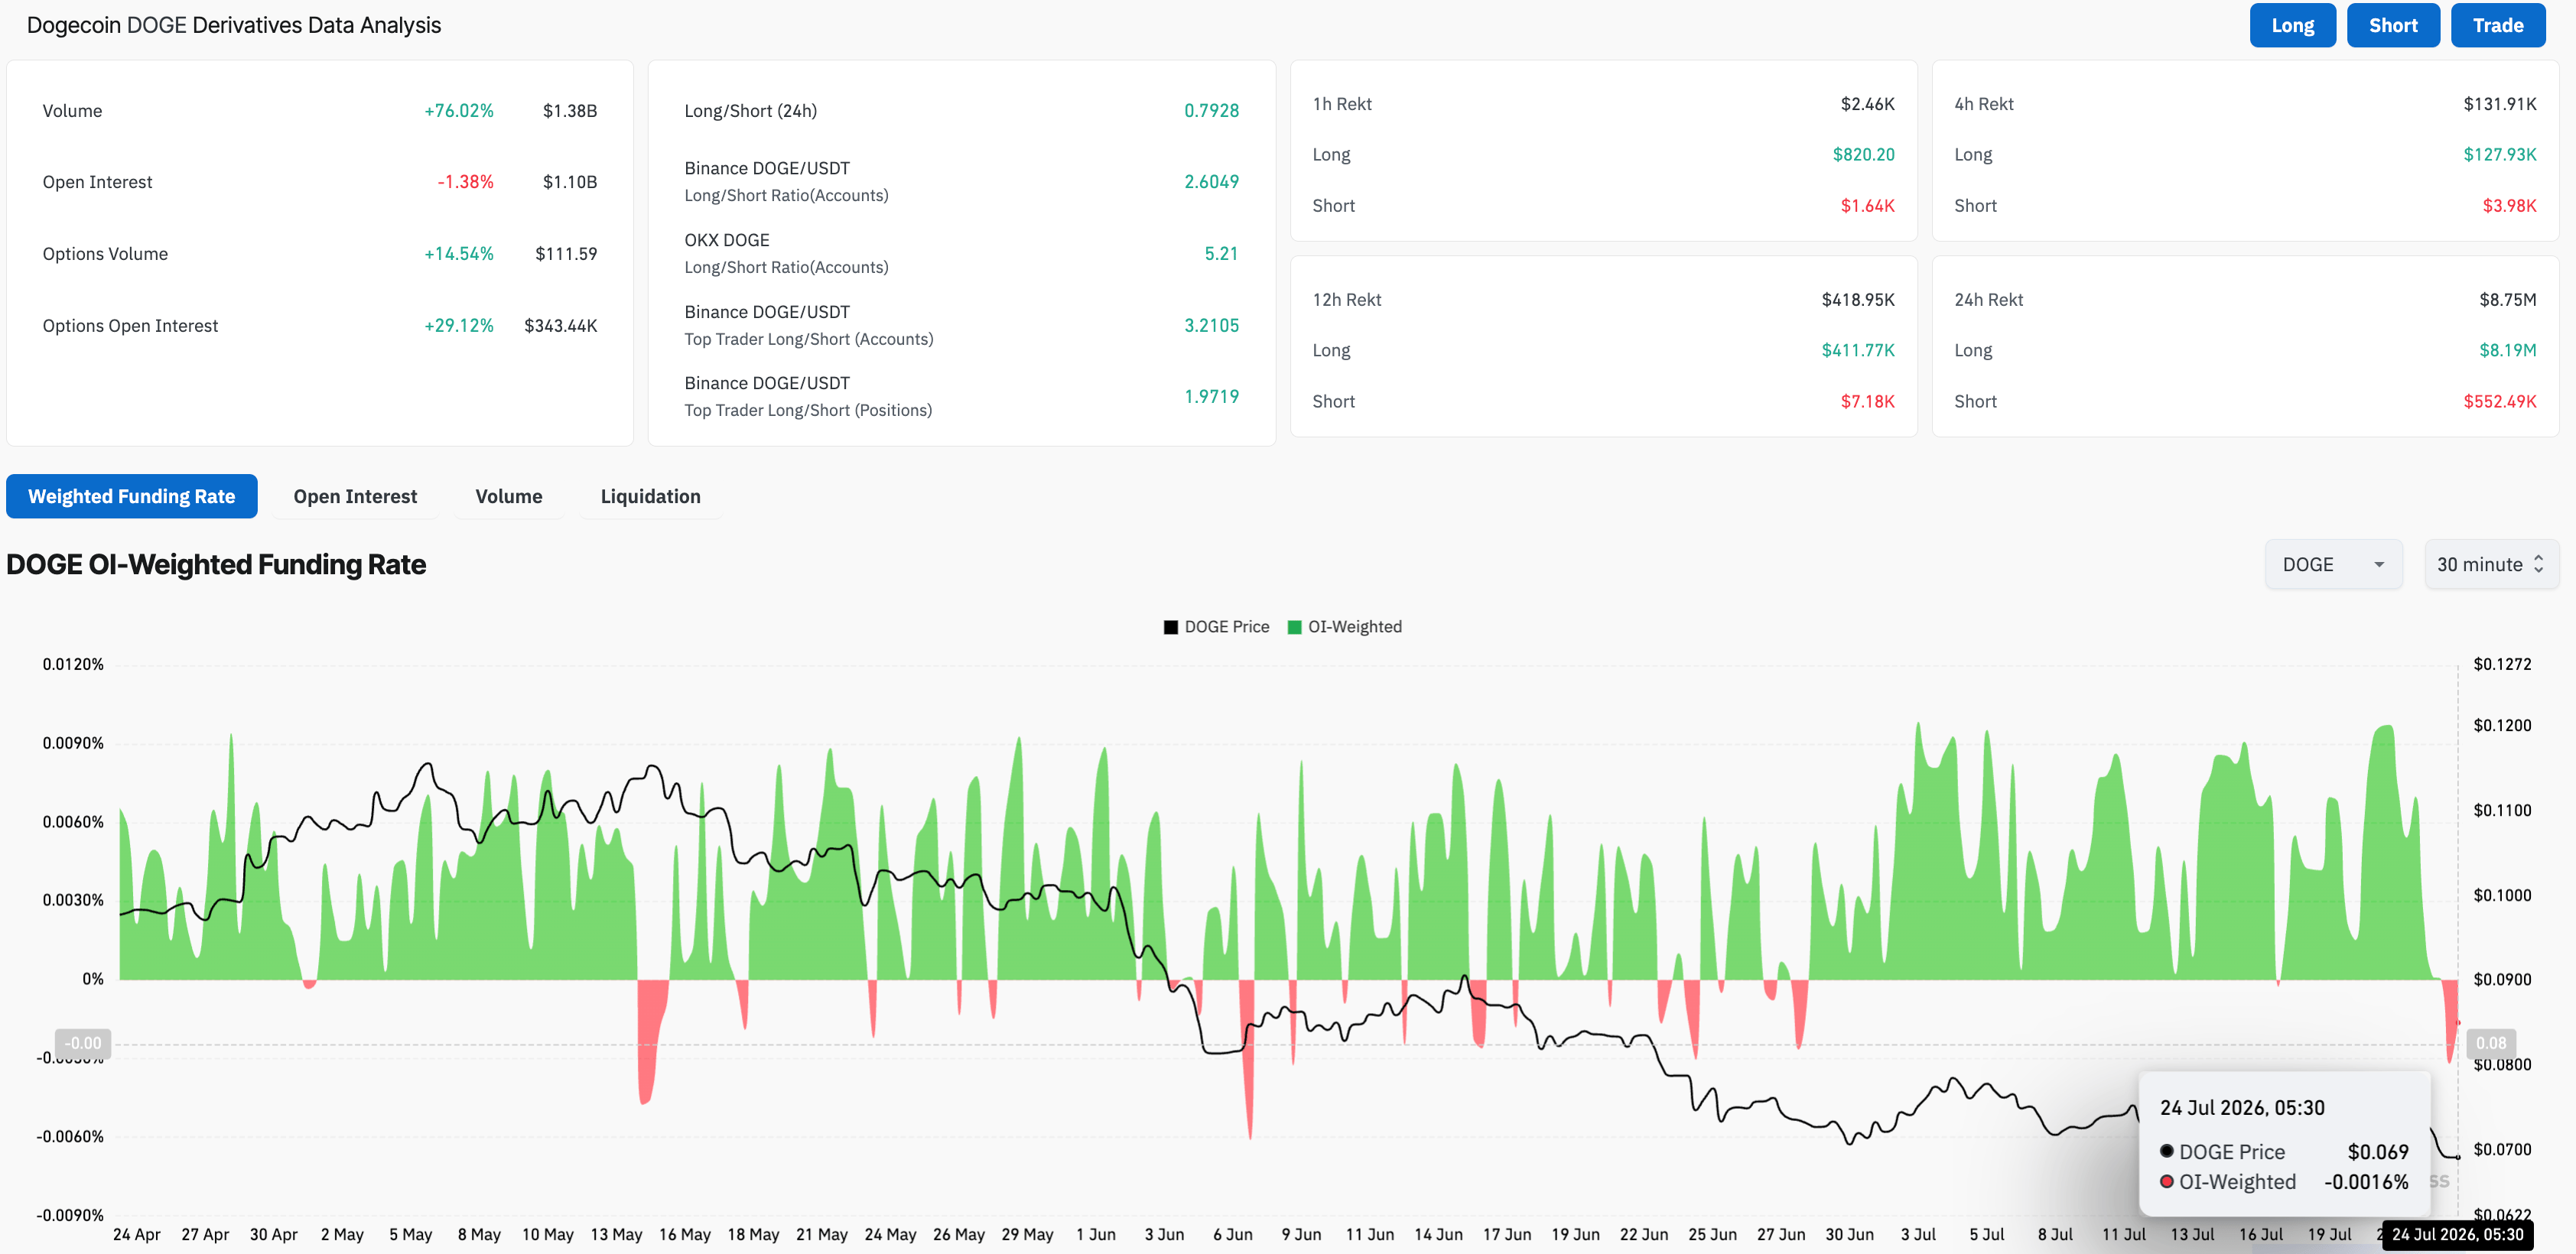
CoinGlass data shows the DOGE futures Open Interest (OI) edges lower to $1.10 billion, reflecting a mild contraction in the notional value of existing perpetual contracts. However, the 76% increase in trading volume to $1.38 billion reflects rising retail activity.
The funding rate of -0.0016% reflects a bearish bias in the retail activity, as traders are willing to buy short positions at a premium. In addition, long liquidation of $8.19 million over the last 24 hours outpaced short liquidation of $552,490, reaffirming the sell-side dominance.
Will Dogecoin extend its decline below $0.0700?
Dogecoin hovers below $0.0700 at press time on Friday after a 5% decline the previous day broke below the $0.0700 threshold. The meme coin maintains a bearish near-term bias, with price holding below both the 50-day Exponential Moving Average (EMA) at $0.0788 and the 200-day EMA at $0.1032.
The pair remains vulnerable to more downside after a sustained decline, with the Relative Strength Index (RSI) hovering at 31, on the verge of signaling oversold conditions. Meanwhile, the Moving Average Convergence Divergence (MACD) tests the signal line, hinting at renewed bearish momentum.
On the downside, the next meaningful support comes in at $0.0641, where buyers would be expected to defend the recent range; a daily close below this floor would likely open the door to a deeper slide despite the nascent improvement in momentum indicators.
On the topside, immediate resistance appears at the horizontal barrier of $0.0700, followed by $0.0777, near the 50-day EMA at $0.0788, which together define a broader supply zone.
(The technical analysis of this story was written with the help of an AI tool. Know more.)
Recommended Articles


