


LayerZero Price Forecast: ZRO risks 25% downside amid 25 million token unlock
- LayerZero edges lower on Monday after two consecutive weeks of losses.
- The monthly supply unlock of 25 million ZRO tokens is scheduled on Monday, implying a potential supply shock ahead.
- Retail interest builds, with trading volume up over 500%, while easing funding rates signal a potential bearish shift.
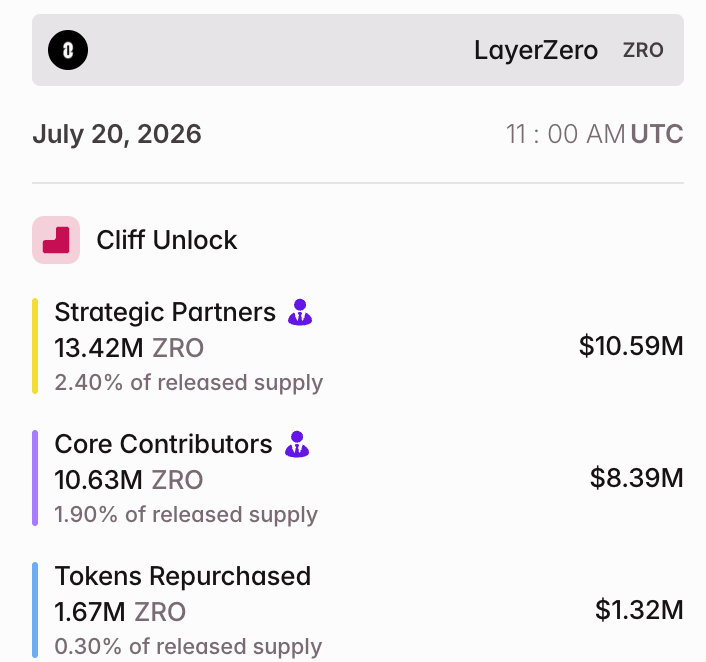
LayerZero (ZRO) price is down roughly 3% on Monday, extending its 9% decline from last week. The upcoming monthly token unlock of 25.71 million ZRO is scheduled for this Monday, which could further increase downside pressure. Retail interest is building ahead of the token unlock, with trading volume up over 500%, while easing funding rates imply a bearish bias.
ZRO monthly token unlock lifts retail interest
LayerZero is gaining retail interest in the derivatives market ahead of its July monthly token unlock. Tokenomist data shows that 4.60% of the total ZRO supply, or 25.71 million tokens, will be unlocked on Monday, benefiting strategic partners and core contributors. In addition, 1.67 million, or 0.30% of released supply, will be bought back, projecting the core team’s confidence in the project.
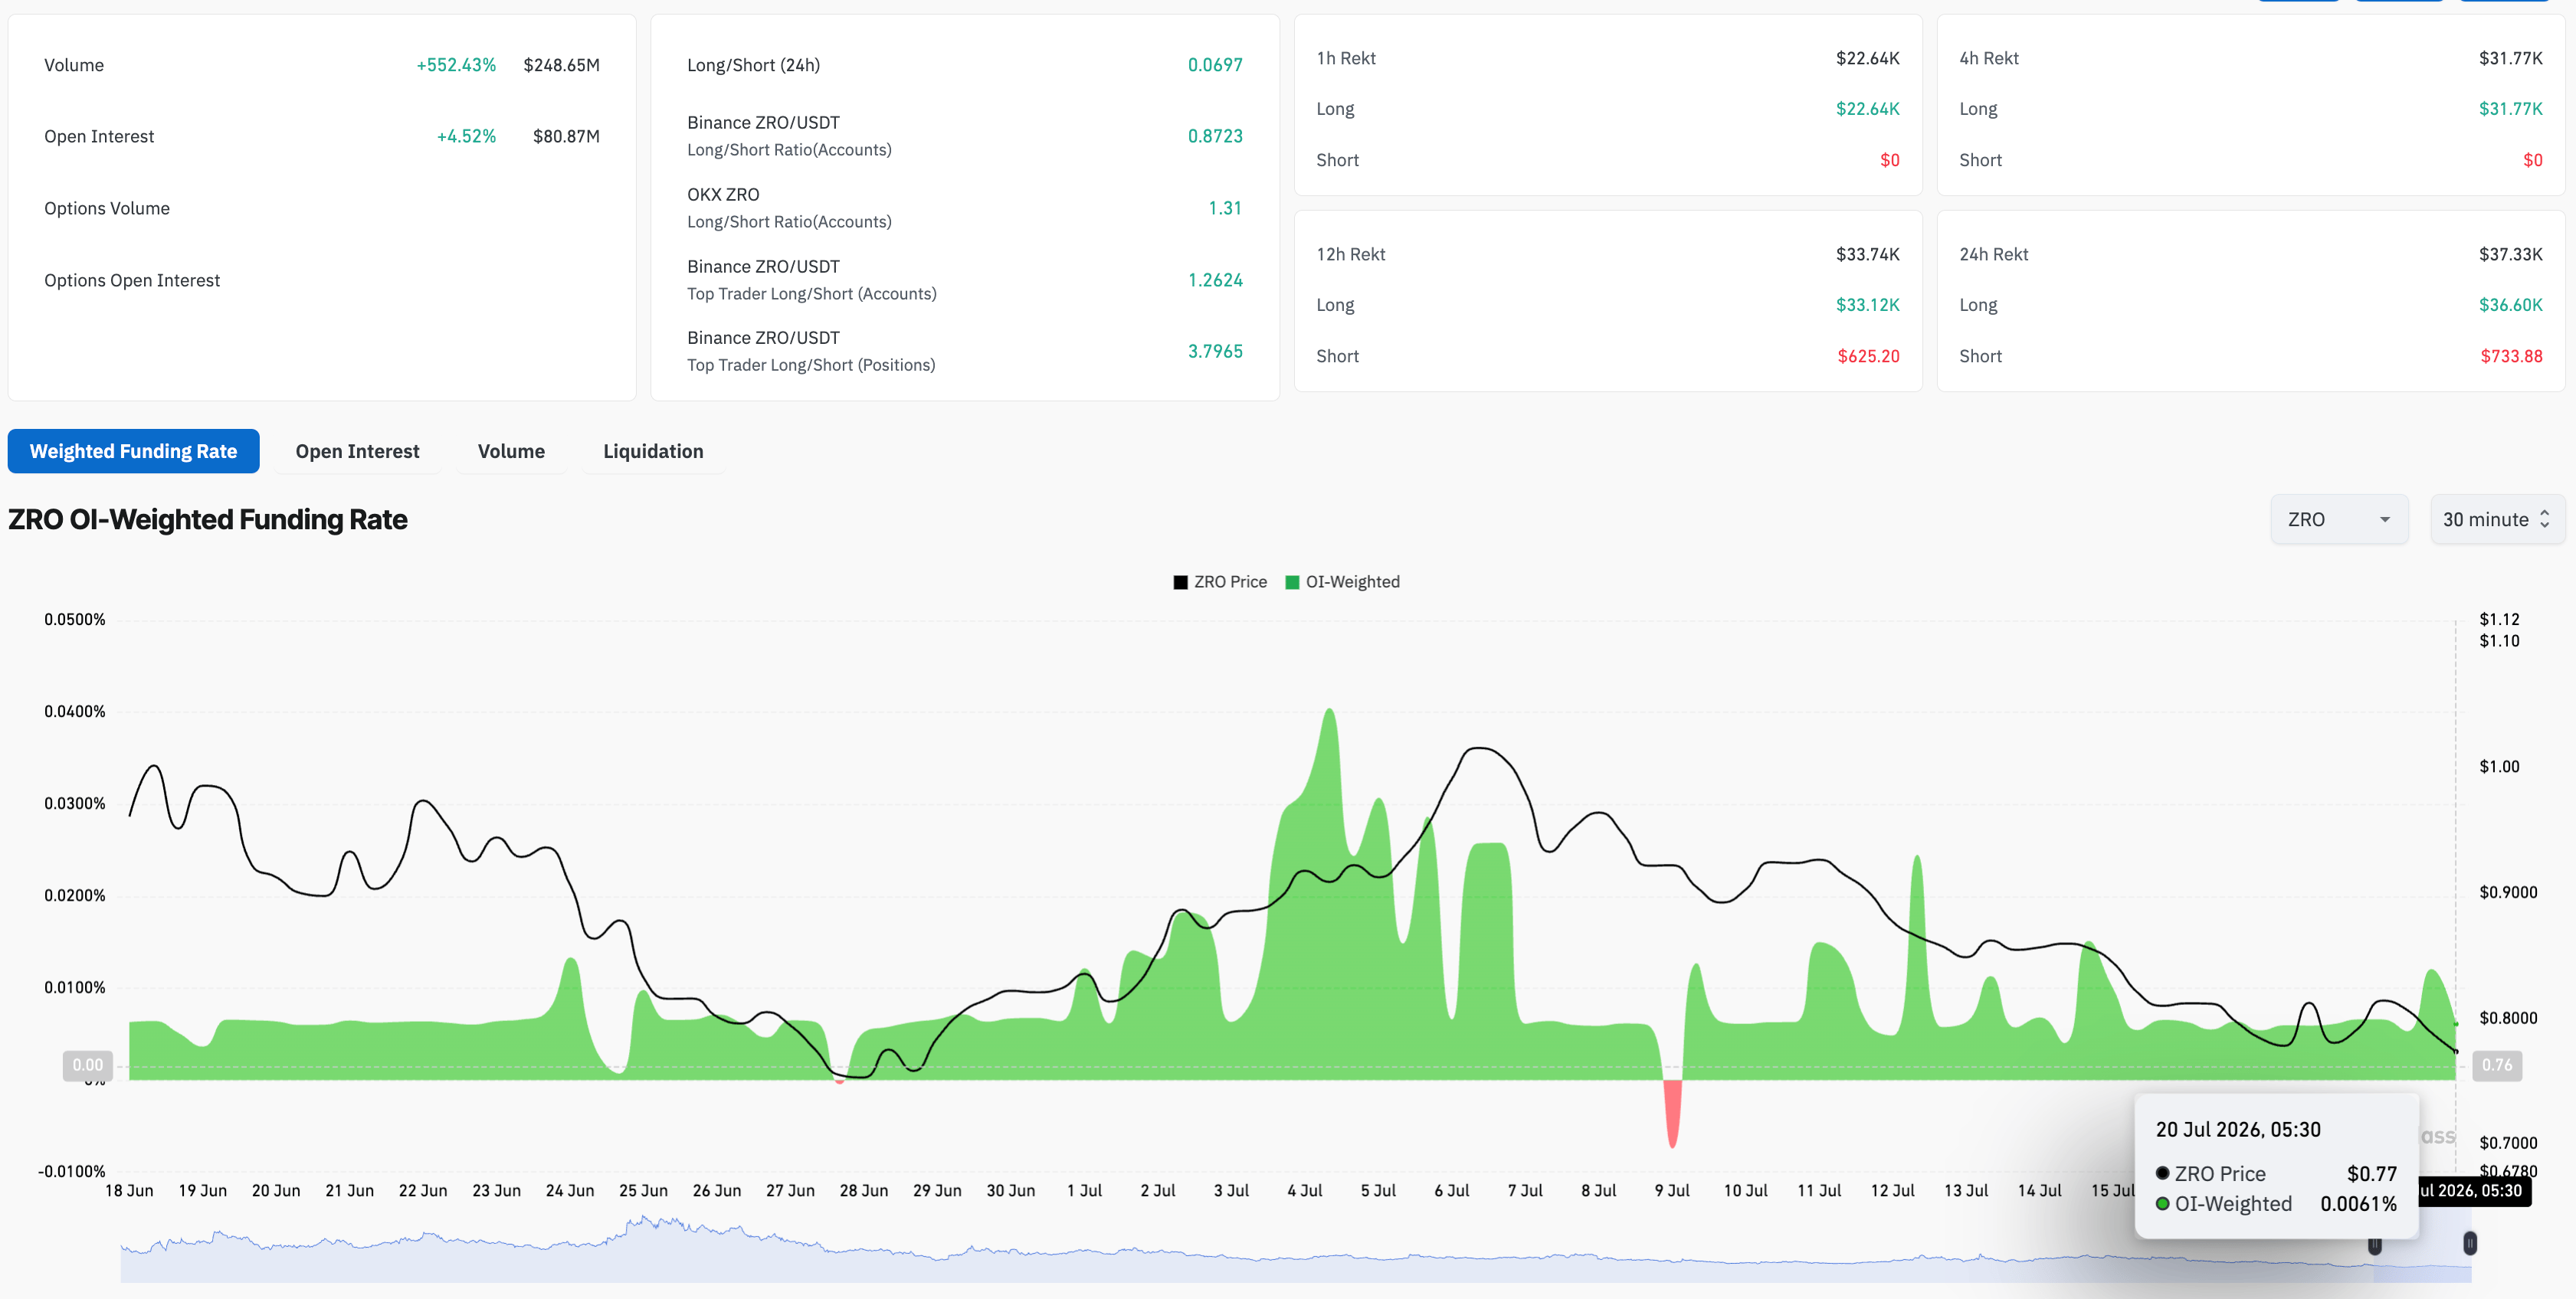
On the retail front, LayerZero derivatives witness a surge in traders’ interest. CoinGlass data show that ZRO futures trading volume is up 552% in 24 hours to $248.65 million, with Open Interest (OI) up 4.52% to $80.87 million, implying a positional buildup. However, the funding rate easing to 0.0061% from 0.0121% the previous day suggests the traders' demand is shifting away from long positions.
Taken together, the easing of bullish bias in the derivatives market is considered a typical response to an upcoming token unlock, as traders anticipate the release of supply as potential selling pressure.
On the downside, the key structural floor is the Fibonacci anchor around $0.73, where a break lower would reinforce the prevailing bearish trend and expose fresh lows in the broader cycle.
Will ZRO prices extend its decline?
LayerZero maintains a near-term bearish bias as price extends a declining trend below its 50-day Exponential Moving Average (EMA) at $0.9575, following a death cross with the 200-day EMA on April 26.. The descending moving averages keeps the broader downtrend intact, with rallies likely to face supply into these overhead barriers.
The Relative Strength Index (RSI) at 36 points to firm bearish momentum rather than outright oversold conditions, while the Moving Average Convergence Divergence (MACD) and signal line descend in the negative territory, hinting that downside pressure persists.
On the downside, the key structural floor around $0.7340, where a break lower would reinforce the prevailing bearish trend and expose fresh lows in the broader cycle. The 127.2% Fibonacci extension level at $0.5322, measured from $2.3930 to $0.7340, could serve as the next support level, suggesting a 25% downside potential.
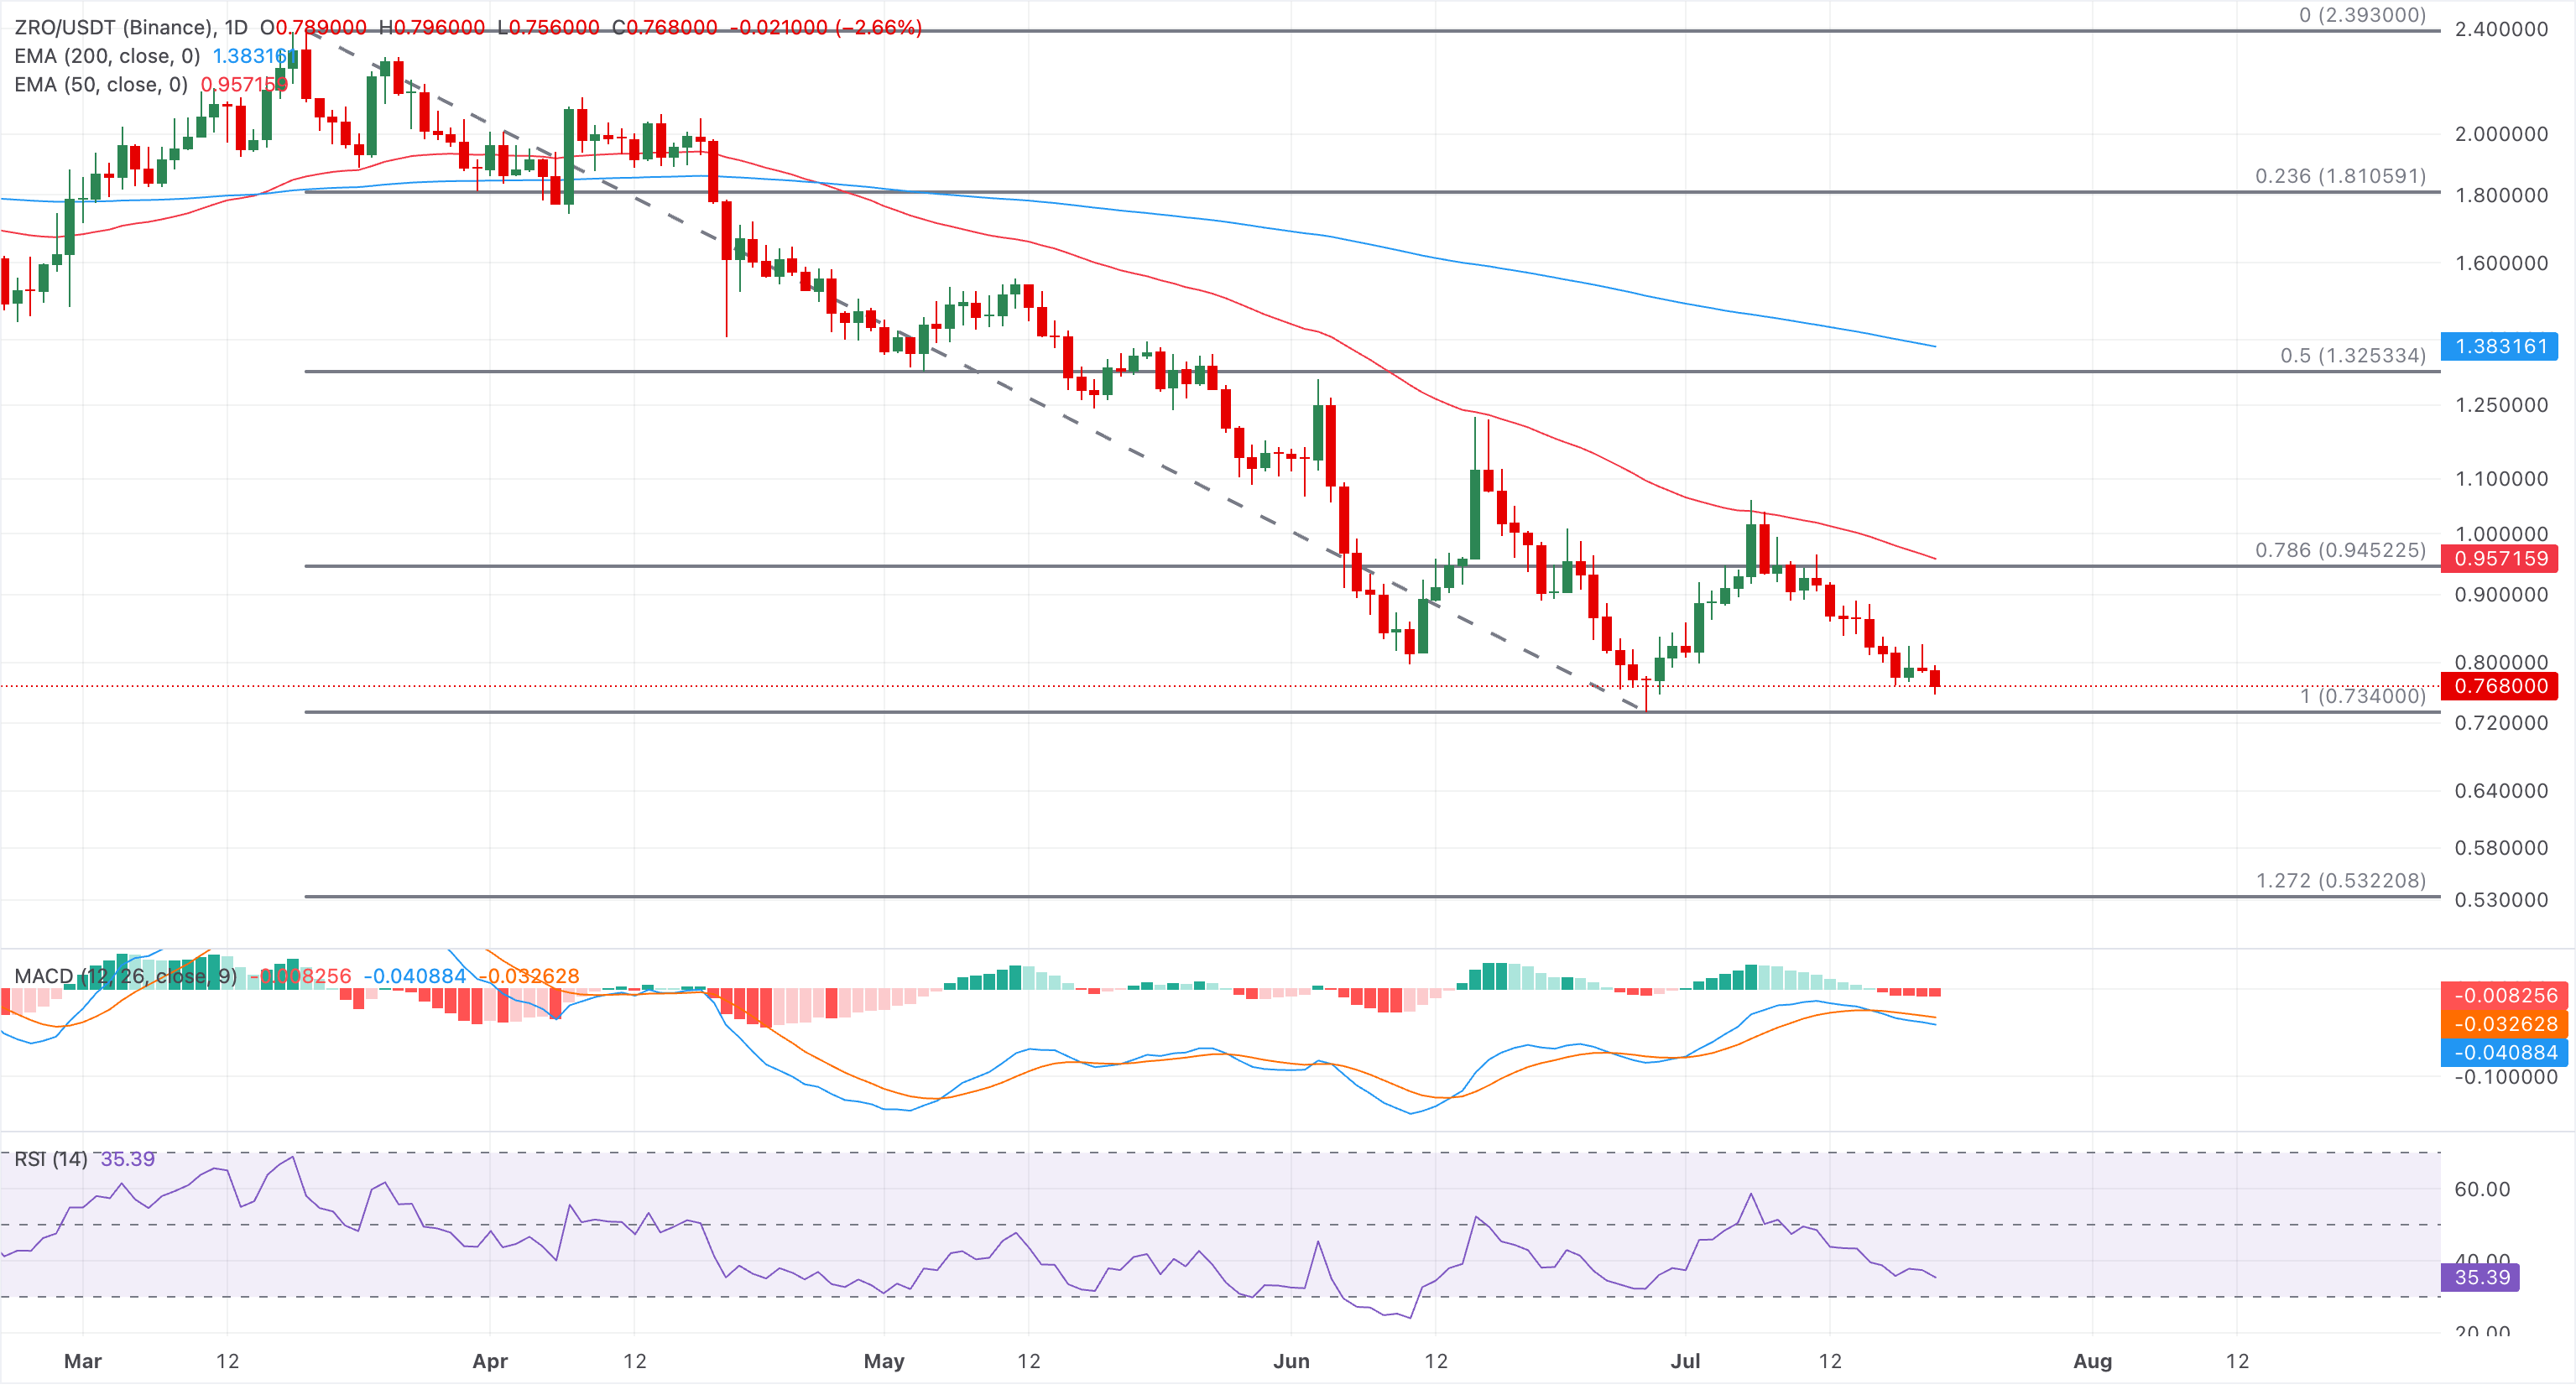
On the topside, initial resistance is seen at the 23.6% retracement level at $0.9452, close to 50-day EMA around $0.9571, and a daily close above this zone would be needed to ease immediate downside pressure and open the way toward the 50% retracement level at $1.3253.
(The technical analysis of this story was written with the help of an AI tool. Know more.)
Recommended Articles


