

Jupiter Price Forecast: JUP extends gains as derivatives sentiment improves

Source Fxstreet
  • Jupiter extends its gains on Wednesday after finding support around the key zones earlier this week.
  • Derivatives metrics support a bullish case with increasing open interest and positive funding rates.
  • The technical outlook favors further gains if the $0.200 level holds.

Jupiter (JUP) extends its recovery, trading above $0.210 on Wednesday after finding support near $0.200 earlier this week. The rebound is backed by improving derivatives metrics, with open interest (OI) climbing and funding rates remaining positive, indicating that traders are increasingly positioning for further upside. Meanwhile, the technical outlook remains constructive, supporting further gains if JUP holds above $0.200. 

Derivatives metrics support a bullish bias

Derivatives metrics show a positive bias for Jupiter. JUP’s futures OI surges to $59.36 million on Wednesday, having risen steadily since mid-June and now remaining in a broader upward trend, supporting a bullish outlook.
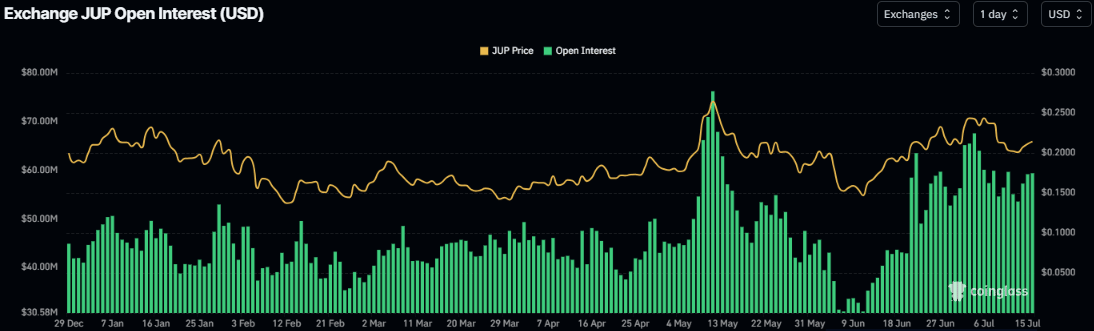
JUP open interest chart. Source: Coinglass

In addition, JUP funding rates flipped positive on July 10 and have remained in positive territory, reading 0.0036% on Wednesday, indicating that longs are paying shorts and supporting bearish sentiment.
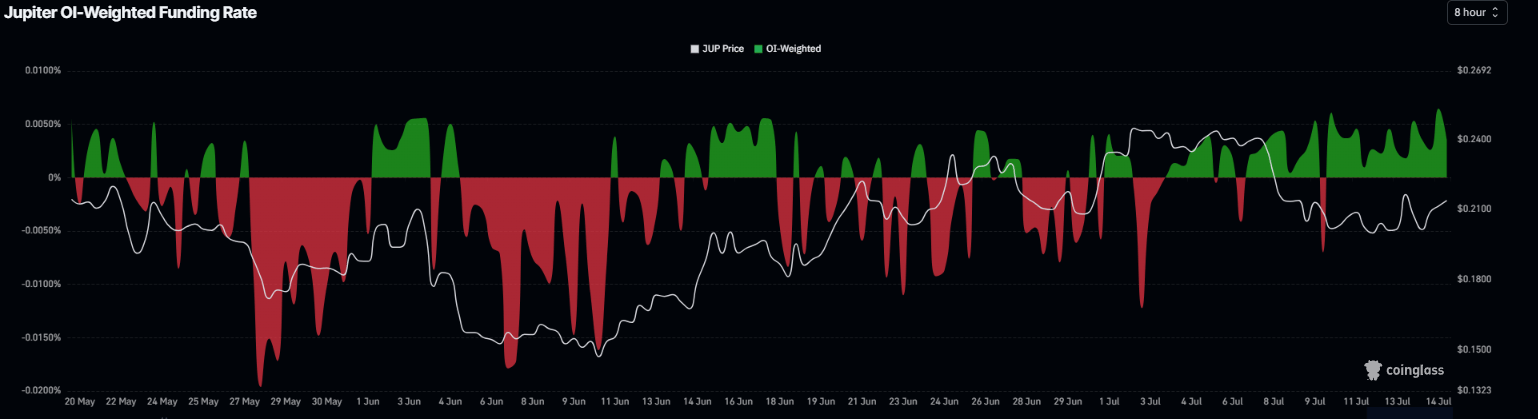
JUP funding rates chart. Source: Coinglass

Moreover, the long-to-short ratio moves toward positive territory, with a reading of 1.01 on Wednesday, further supports a bullish bias.
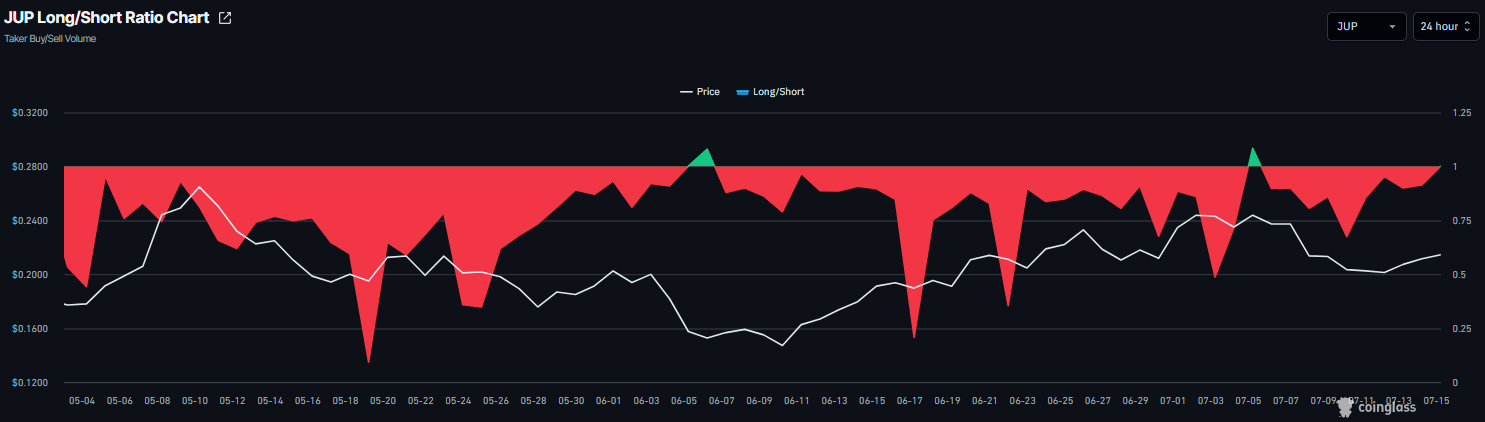
JUP long-to-short ratio chart. Source: Coinglass

Jupiter Price Forecast: Key support holds strong 

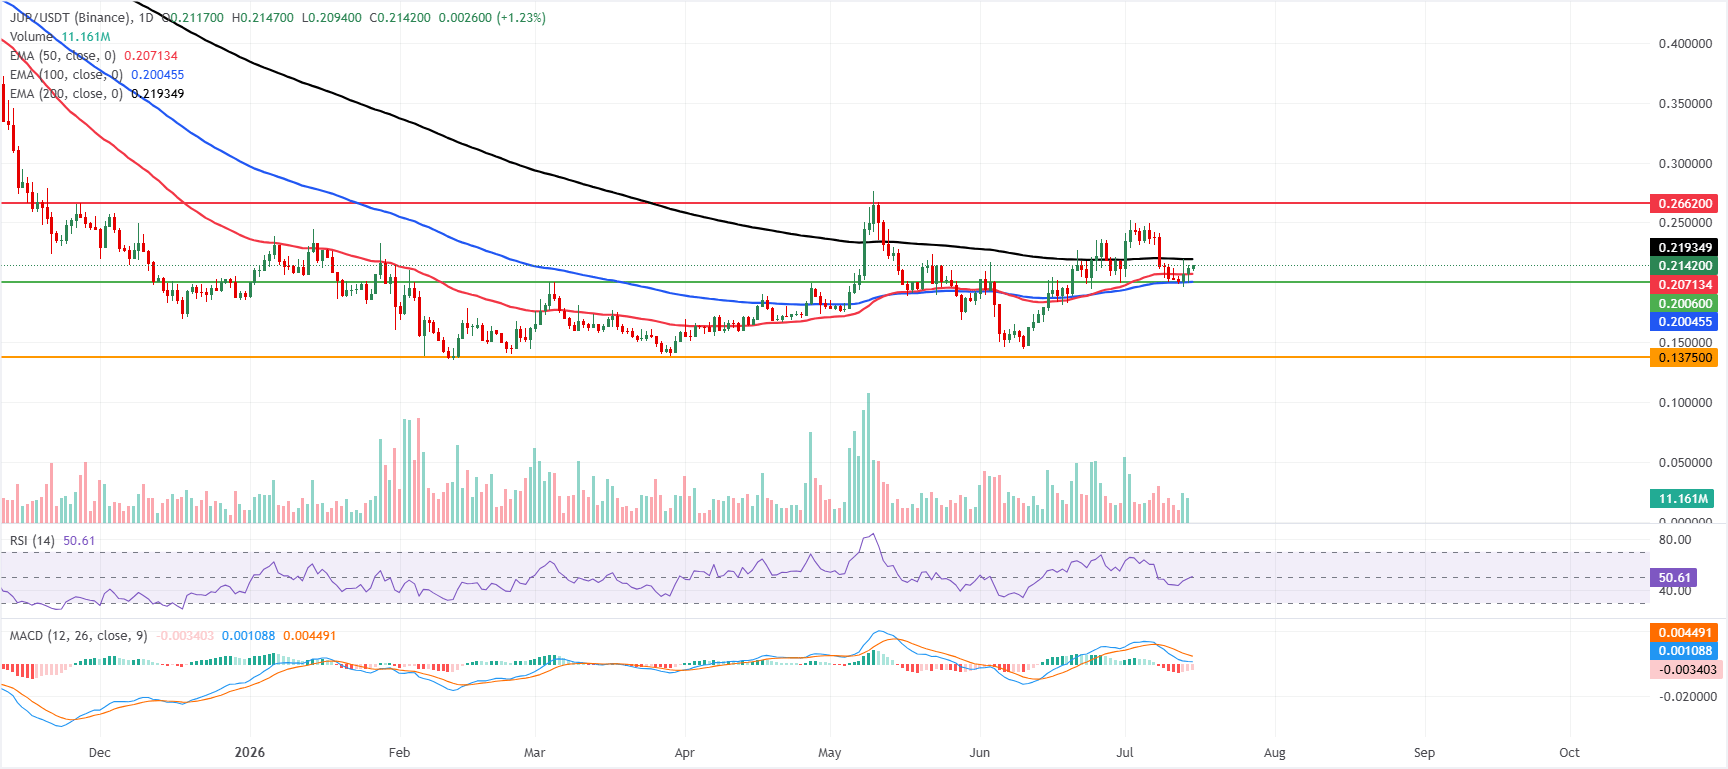
Jupiter price trades at $0.210 on Wednesday, extending its recovery for the third consecutive day so far this week. JUP sits between its major Exponential Moving Averages (EMAs), holding above the 50-day EMA at $0.207 and the 100-day EMA at $0.200 while remaining capped by the 200-day EMA at $0.219, which keeps the near-term tone neutral rather than clearly bullish. 

The Relative Strength Index (RSI) around 50 hints at balanced momentum, while the Moving Average Convergence Divergence (MACD) indicator stays slightly negative, suggesting that upside attempts lack strong follow-through for now.

On the downside, immediate demand is seen at the horizontal support near $0.200, reinforced by the nearby 50-day and 100-day EMAs clustered just below current levels, ahead of a more distant structural floor at $0.137. 

On the topside, initial resistance is defined by the 200-day EMA at $0.219, and a sustained break above this level could pave the way toward the next notable cap at $0.266.
(The technical analysis of this story was written with the help of an AI tool. Know more.)

Disclaimer: For information purposes only. Past performance is not indicative of future results.
placeholder
Broadcom Sales Miss Sparks Profit-Taking Rout in Asian AI and Chip StocksAsian semiconductor and artificial intelligence shares tumbled after Broadcom’s mixed quarterly results and flat sales guidance triggered widespread profit-taking, exposing the tech sector’s vulnerability following a massive May rally.
Author  Mitrade Team
6 Month 04 Day Thu
Asian semiconductor and artificial intelligence shares tumbled after Broadcom’s mixed quarterly results and flat sales guidance triggered widespread profit-taking, exposing the tech sector’s vulnerability following a massive May rally.
placeholder
Gold Price Analysis (XAU/USD): Gold Falls to 6-Month Low as Inflation Fuels Rate Hike Bets, A Buying Opportunity or a Falling Knife? Gold hit a 6-month low on Fed rate hike bets. However, strong central bank buying and technical indicators suggest potential tactical bounces and long-term accumulation windows.
Author  Mitrade Team
6 Month 12 Day Fri
Gold hit a 6-month low on Fed rate hike bets. However, strong central bank buying and technical indicators suggest potential tactical bounces and long-term accumulation windows.
placeholder
XRP Price Prediction for July 2026: Can Buyers Finally Break the Downtrend?XRP (XRP) price trades near $1.05, caught between a year-long downtrend and a sudden burst of buying.July has historically rewarded XRP holders. This year the month arrives with on-chain accumulation
Author  Beincrypto
6 Month 30 Day Tue
XRP (XRP) price trades near $1.05, caught between a year-long downtrend and a sudden burst of buying.July has historically rewarded XRP holders. This year the month arrives with on-chain accumulation
placeholder
Smart Money is Leaving Nvidia for This AI Chip StockNvidia stock price keeps sliding, yet the usual dip buyers are missing. Institutional money flow on the stock is the most negative of any major chip name, which means big investors are stepping back i
Author  Beincrypto
6 Month 30 Day Tue
Nvidia stock price keeps sliding, yet the usual dip buyers are missing. Institutional money flow on the stock is the most negative of any major chip name, which means big investors are stepping back i
placeholder
What to Expect From Ethereum (ETH) in July 2026Ethereum (ETH) enters July 2026 trading near $1,570, close to multi-month lows, after recording its first run of three consecutive red quarterly candles in its history.On-chain data and price charts n
Author  Beincrypto
7 Month 01 Day Wed
Ethereum (ETH) enters July 2026 trading near $1,570, close to multi-month lows, after recording its first run of three consecutive red quarterly candles in its history.On-chain data and price charts n
Related Instrument
goTop
quote