


Ethereum Price Forecast: ETH derivatives flip bullish, but uptrend isn't leverage-driven
Ethereum price today: $1,780
- Ethereum has rallied 14% since the Net Taker Volume flipped positive.
- Open interest has remained flat despite the gains, indicating that the uptrend isn't leverage-driven.
- ETH faces rejection around $1,806 at the 50-day EMA.
Following improving sentiment across the crypto market, Ethereum (ETH) briefly recovered the $1,800 level over the past week, recording roughly a 10% gain.
The move follows a positive flip in the Ethereum Net Taker Volume, which measures the difference between buying and selling volume in ETH perpetual markets. Positive values indicate dominant buying pressure, and vice versa for negative values.
ETH's decline from May to late June began after the metric flipped negative. Similarly, the top altcoin has gained nearly 14% since the metric turned positive on June 28.
-1783456085907.png)
Despite the positive flip and price rise, open interest has remained largely flat during the period. The Estimated Leverage Ratio, which compares an asset's open interest to its exchange reserves, is also yet to see a meaningful rise since its June decline.
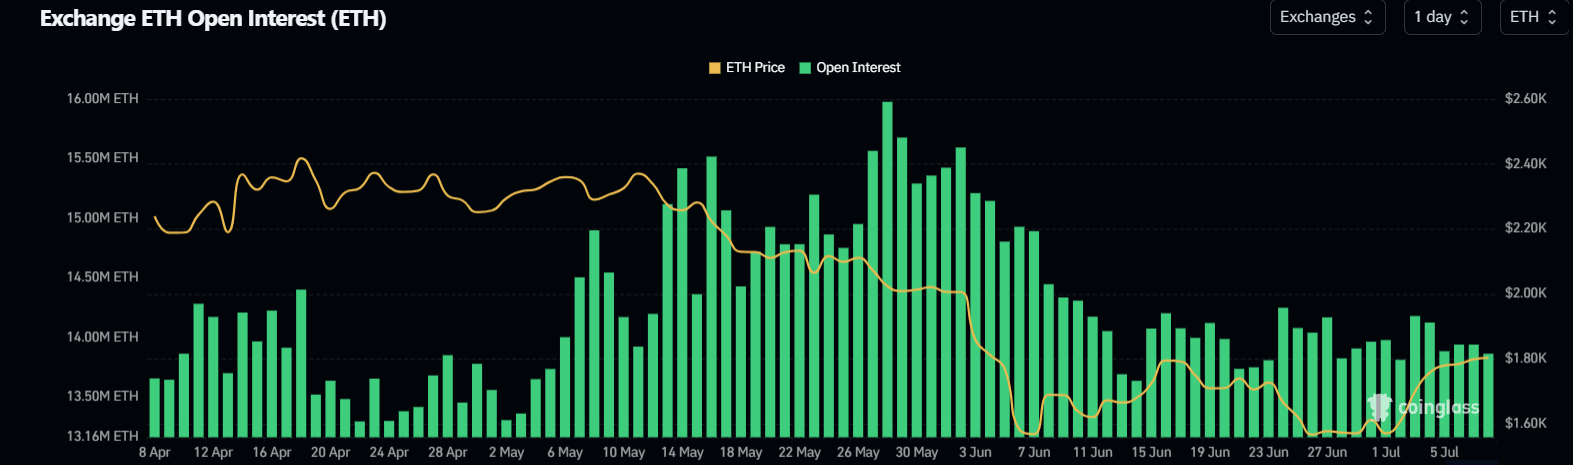
The derivatives data indicates that, while traders are now leaning positive, ETH's recent uptrend isn't leverage-driven, making it less susceptible to leverage squeezes. On the flip side, it also indicates continued cautious sentiment among these long traders as they're yet to commit to an upside bias.
Meanwhile, US sentiment has also been improving since last week's softer-than-expected US labor market data. The ETH Coinbase Premium Index, a measure of US sentiment, remains in negative territory, but has eased considerably from extreme levels since the beginning of July.
-1783456153415.png)
Similarly, US spot ETH exchange-traded funds (ETFs) have posted three consecutive days of net inflows, per SoSoValue data.
Ethereum Price Forecast: ETH set for rejection at 50-day EMA
Ethereum has recorded $103.1 million in liquidations over the past 24 hours, led by $78.4 million in short liquidations, according to Coinglass data.
On the daily chart, ETH remains capped beneath the medium- and long-term structure, holding below the 50- and 100-day Exponential Moving Averages (EMAs) at $1,806 and $1,970, respectively. The Relative Strength Index (RSI) at 57 reinforces a constructive but not yet bullish tone, while the Stochastic Oscillator (Stoch) near 86 hints at overbought conditions that could limit immediate upside.
On the topside, initial resistance is clustered around the convergence of the horizontal barrier at $1,806 and the 50-day EMA, with the next level at $1,909. Higher hurdles are at the 100-day EMA and $2,018, with stronger caps emerging at $2,108 and $2,211.
On the downside, immediate support is seen around the horizontal level at $1,741, ahead of the 20-day EMA at $1,713, with deeper floors at $1,524 and $1,405. The $1,156 level is a more distant structural support if selling pressure resumes.
(The technical analysis of this story was written with the help of an AI tool. Know more.)
Recommended Articles


