

Non-Farm Payrolls Surprise Decimates Shorts; Bitcoin Strongly Reclaims $60,000 As MicroStrategy Surges 8% to Break $100
TradingKey - US June non-farm payrolls fell far short of expectations, driving Bitcoin and Strategy prices to surge past key levels, with further short-term rebounds expected.
On July 2, Eastern Time, the "unexpectedly weak" US non-farm payrolls data triggered a retaliatory surge in crypto assets, leading to a collective liquidation of short sellers. Among them, Bitcoin ( BTC) jumped past the $60,000 mark, temporarily trading at $61,440, while Bitcoin proxy stock Strategy ( MSTR) rose 7.9% to break above the $100 mark, closing at $100.77.
On Thursday, the US Bureau of Labor Statistics (BLS) announced that total non-farm employment in June increased by only 57,000, far below the market expectation of 114,000. Such weak job growth basically dispelled the cloud of monetary tightening previously cast by the new Federal Reserve Chairman, Kevin Warsh. On the same day, Warsh released a dovish signal at the Central Bank Forum that "inflation risks have diminished significantly," causing Wall Street's expectations for rate hikes in the second half of the year to instantly vanish, shifting instead to aggressively pricing in a "restart of rate cuts," which triggered a collective eruption of long-pent-up liquidity.
Prior to the data release, the cryptocurrency market was suffering from up to $4.5 billion in ETF outflows in June, with Bitcoin struggling on the edge of the $60,000 life-and-death line for the past seven days. Following the release of the US non-farm payrolls data, both the US Dollar Index and US Treasury yields plummeted from their highs. As a highly liquidity-sensitive global asset, Bitcoin instantly surged, triggering a short squeeze that not only easily secured its footing above $60,000 but also spiked upward to briefly break through $62,000. Currently, Bitcoin's price has reversed its recent technical weakness, returning to the $60,000–$67,000 trading range and flashing bullish signals.
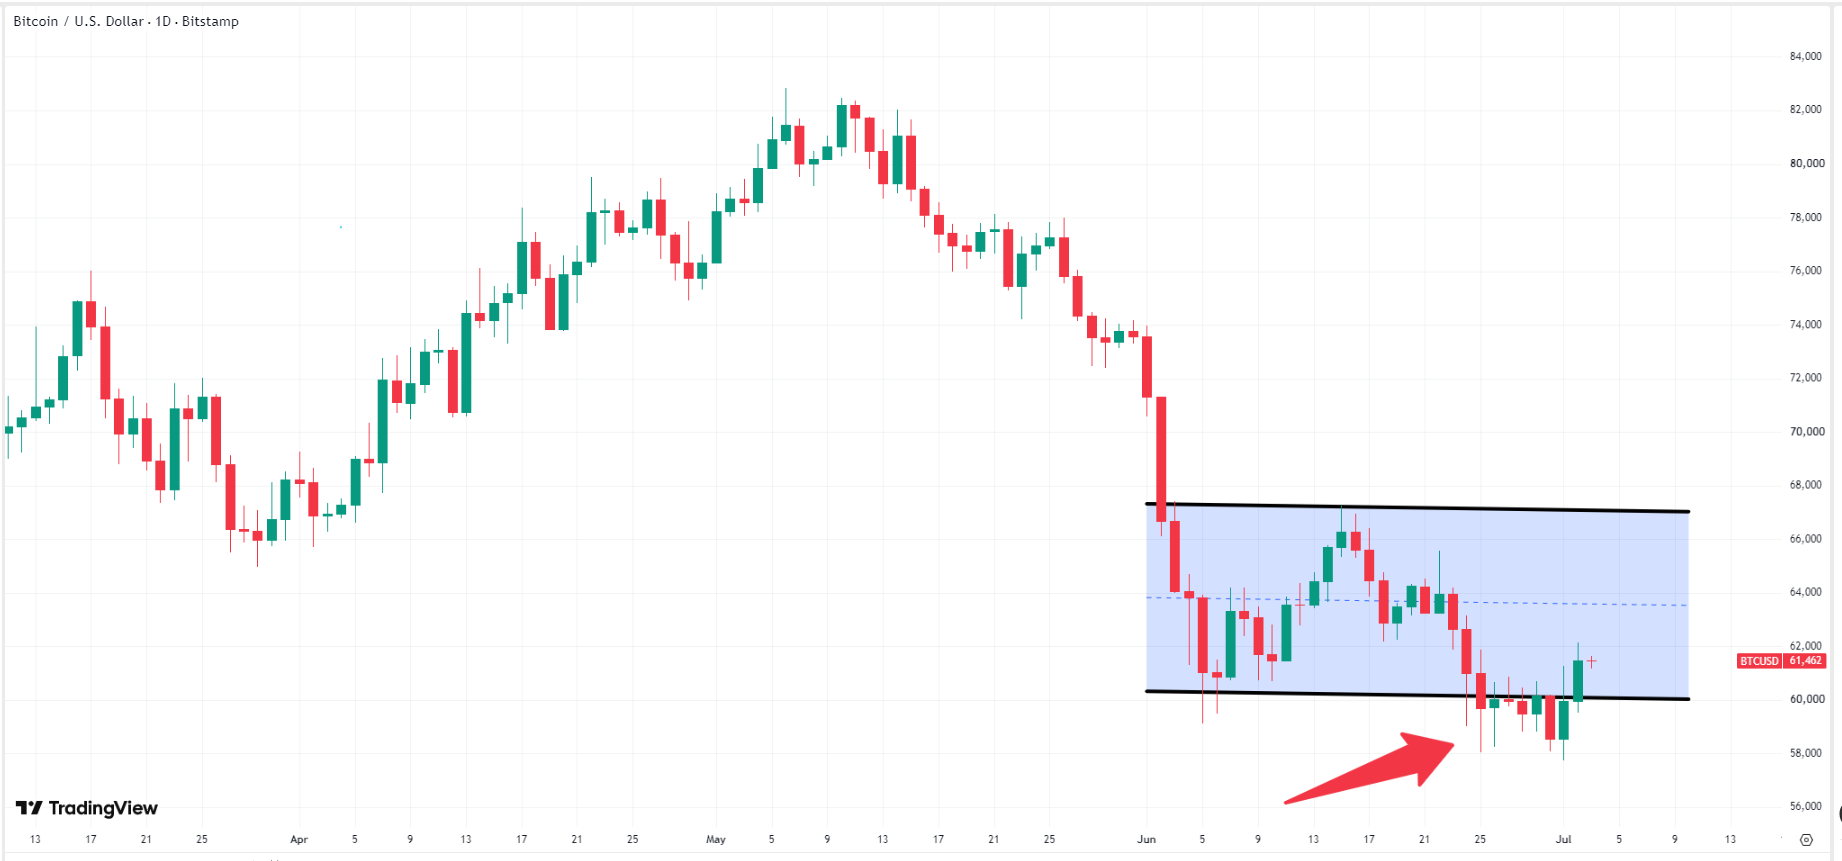 Bitcoin Price Chart, Source: TradingView
Meanwhile, Strategy, the company with the largest Bitcoin holdings, saw its stock price extend its gains to mark a four-day winning streak, strongly breaking through the $100 threshold and significantly boosting market confidence. In early June, Strategy announced its first-ever sale of Bitcoin, a move that shattered the "buy only, never sell" belief and triggered panic selling in the market, causing mutual downward pressure on both Bitcoin and Strategy.
The greater significance of the recovery in Bitcoin's price lies in the expansion of floating profits on Strategy's balance sheet, enabling it to once again issue convertible bonds at a premium to raise low-cost capital and, in turn, continue aggressively buying Bitcoin in the secondary market. This virtuous cycle of "rising Bitcoin → rising Strategy stock price → Strategy issuing bonds to buy Bitcoin → Bitcoin rising further" is the core driver pushing Wall Street's institutional forces to frantically accumulate shares and drive the stock price to challenge its next resistance level.
From a technical analysis perspective, once Strategy's stock price breaks through the $110 resistance level, it will fully open up its upside potential to challenge the $200 mark, provided that Bitcoin can hold the $60,000 support level. If Bitcoin loses this level or even sets new lows, Strategy's stock price will also decline, making an independent rally virtually impossible.
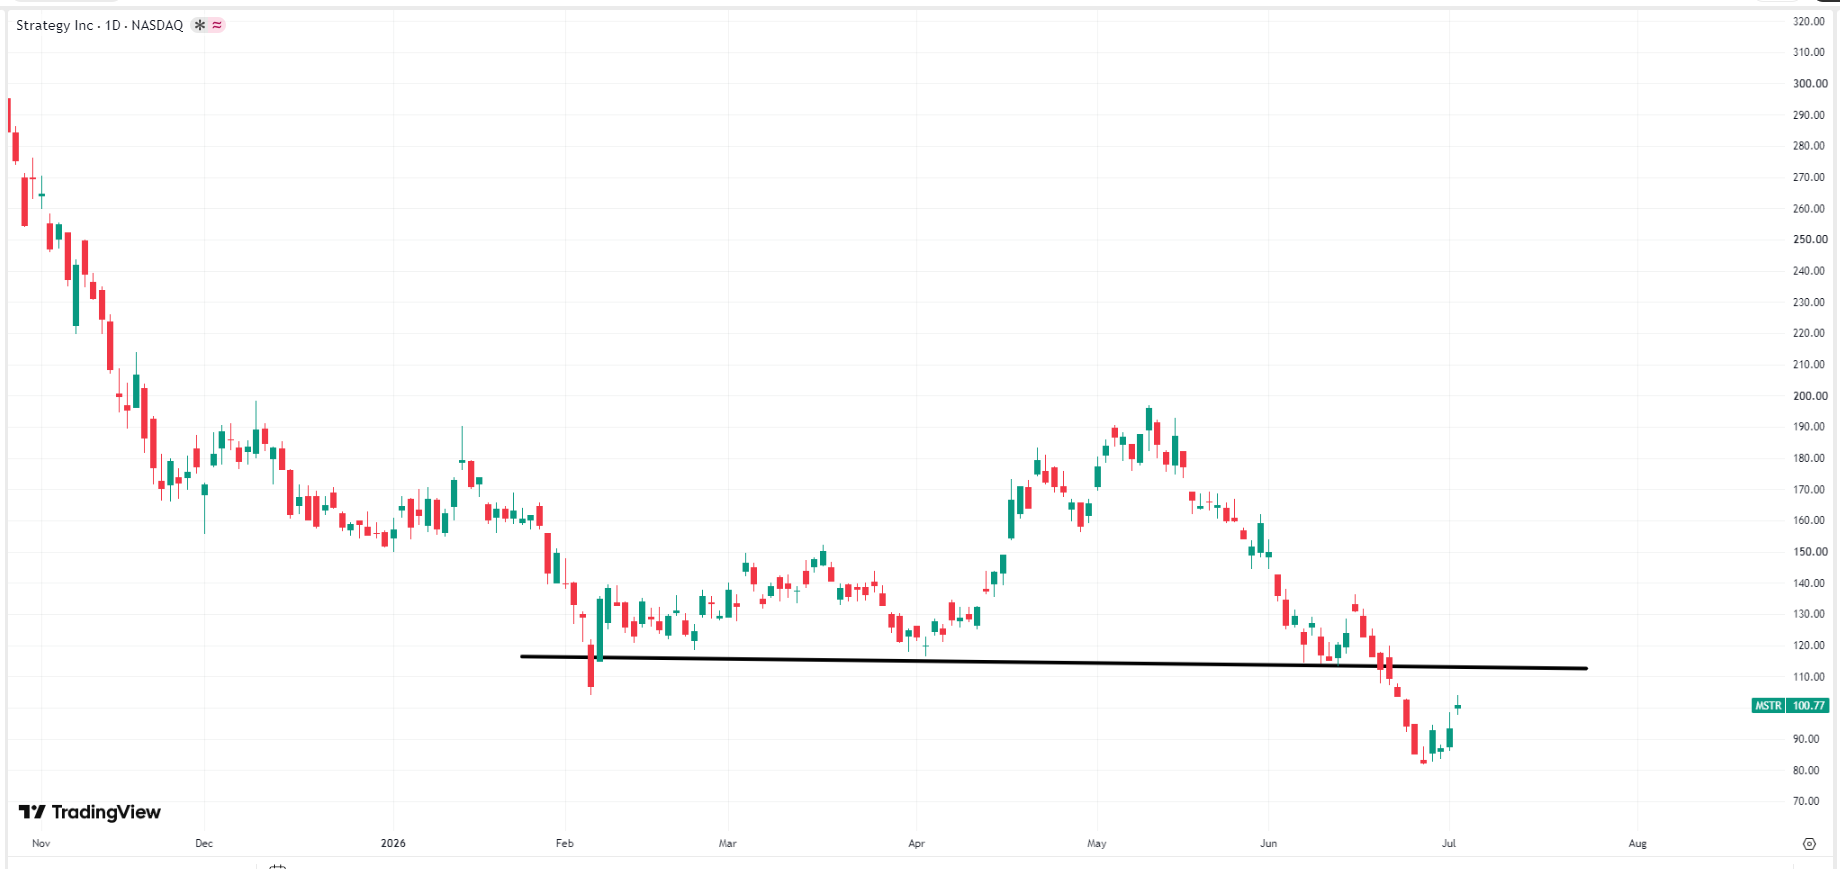 Strategy Stock Price Chart, Source: TradingView
Recommended Articles


