


Ethereum Price Forecast: ETH risks a long squeeze as rising Treasury yields weigh on risk assets
Ethereum price today: $2,220
- Ethereum briefly fell below $2,110 on Friday, marking its lowest level in over a month amid a surge in US Treasury yields.
- ETH's open interest climbed to a record high while funding rates continued a week-long positive streak despite declining prices, increasing the potential for a long squeeze.
- ETH could flip the 10-week EMA to a resistance if it sustains a weekly close below $2,267.
Ethereum (ETH) is down 3.3% on Friday following a general decline across risk assets.
The move comes amid surging US Treasury yields, with the 10Y Note Yield extending gains to 4.59%, its highest level since May 2025. A rise in Treasury yields typically acts as a headwind for risk assets like cryptocurrencies as it signals higher borrowing costs and increased competition for capital, often prompting a shift toward safer, income-generating government bonds.
ETH saw a quick decline to $2,207, its lowest level in over a month, before slightly picking up. The top altcoin appears to have mirrored a similar move in stocks, with the Nasdaq-100 falling 1.23% on the day, as ETH maintains a pattern of being a high beta of the index majorly during downturns.
On the derivatives side, new capital is entering the market as Ethereum's futures open interest has surged to a record high of 15.6 million ETH — two days after breaking its previous high — despite the price decline.
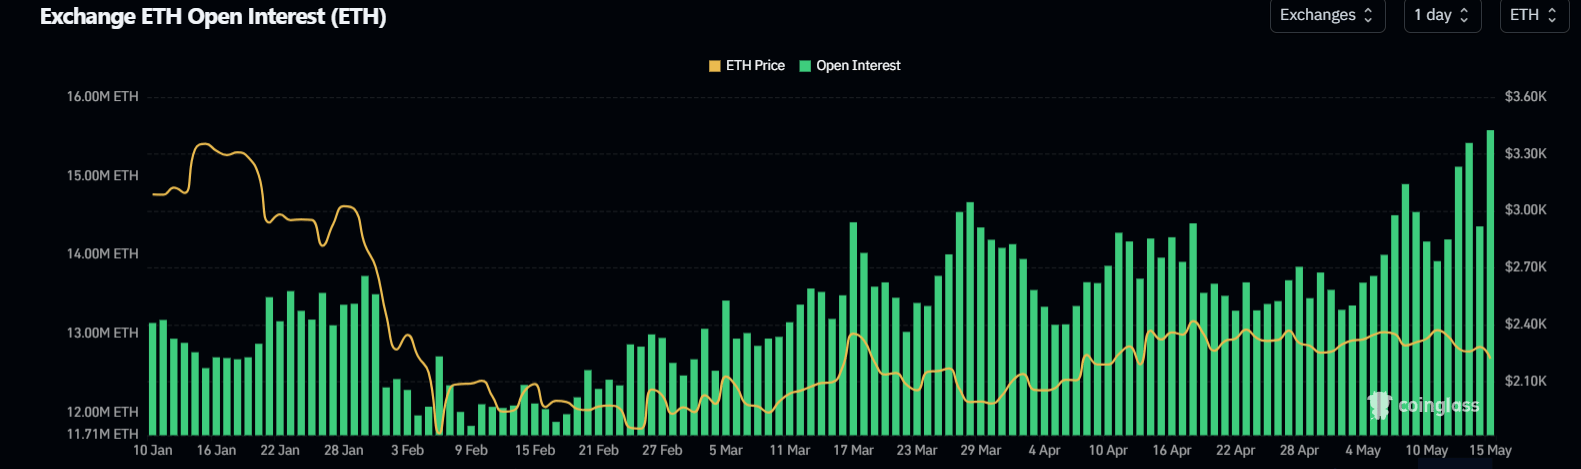
Open interest is the total worth of outstanding contracts in a derivatives market.
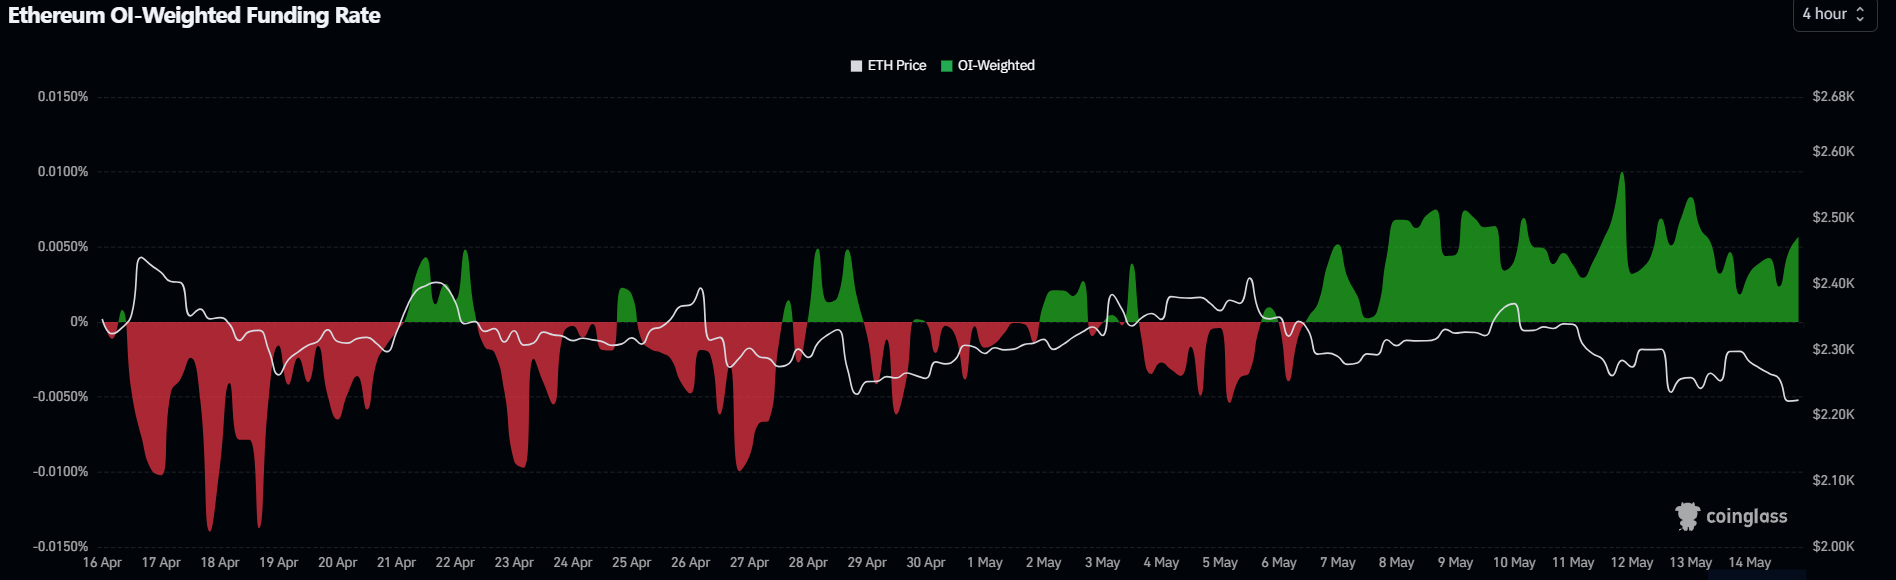
Funding rates, which are periodic payments between traders of perpetual contracts, have also continued in positive territory for more than a week, the longest streak since January. The move in derivatives indicates that longs are holding on to their positions despite the price decline, leaving room for a potential long squeeze if prices continue to decline.
On the traditional market side, US spot exchange-traded funds (ETFs) have recorded consistent net negative flows throughout the week, with four consecutive days of outflows totaling roughly $189 million, according to SoSoValue data.
Ethereum Price Forecast: ETH risks flipping 10-week EMA to resistance
Ethereum has recorded $103 million in liquidations over the past 24 hours, driven by $97 million in liquidated long positions.
In the weekly chart, ETH holds beneath the 10- and 20-week Exponential Moving Averages (EMAs) at $2,267 and $2,415, keeping the broader structure under bearish pressure as all key medium and long-term EMAs fan out above price. The Relative Strength Index (RSI) around 41 hints at subdued buying interest, while the Stochastic Oscillator's (Stoch) decline toward mid-range and its moving average suggest waning bullish pressure in a capped environment.
On the topside, ETH could flip the 10-week EMA to a resistance if it sustains a weekly close below $2,267. The resistance comes ahead of the horizontal barrier at $2,388 and the 20-week EMA around $2,416. Further up, the 50-week EMA at $2,725 and nearby horizontal resistance at $2,746 converge into a thicker supply zone, before the 100-week EMA at $2,788 and the distant $3,412 level.
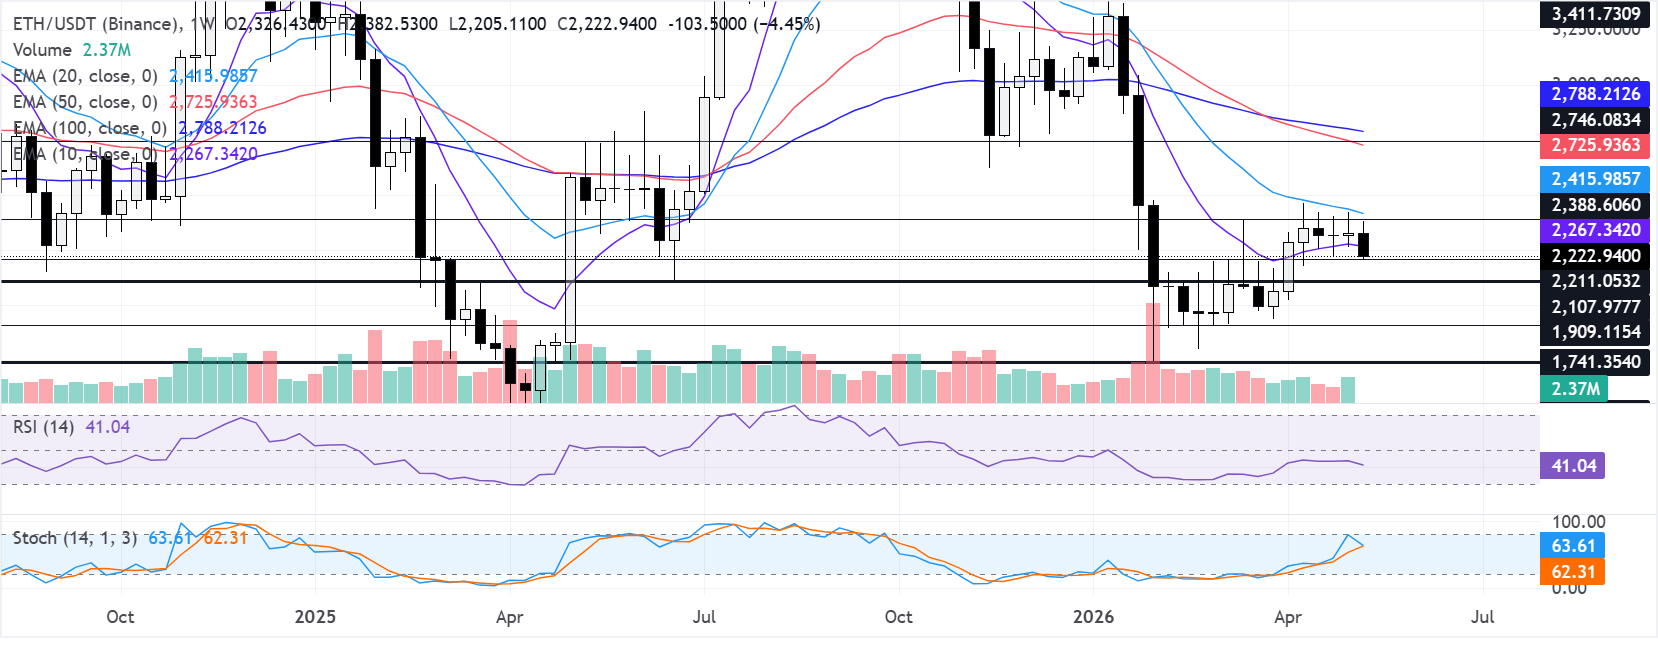
On the downside, immediate support is seen at $2,211, followed by $2,108. A break lower would expose $1,909, with deeper cushions at $1,741, $1,524 and $1,405 if selling pressure accelerates.
(The technical analysis of this story was written with the help of an AI tool.)
Recommended Articles


