


Gold falls as Middle East tensions lift Oil prices, Fed rate hike bets
- Gold snaps a four-day winning streak as the US Dollar rebounds and US Treasury yields move higher.
- Hawkish Fed expectations weigh on Gold as rising energy prices fuel inflation concerns.
- XAU/USD faces resistance at $4,200 while holding above the 21-day SMA at $4,070.
Gold (XAU/USD) loses ground on Thursday, snapping a four-day winning streak as the US Dollar (USD) rebounds, while Oil prices extend their gains on rising tensions in the Middle East. At the time of writing, XAU/USD trades around $4,090 after hitting a two-week high of $4,165 on Wednesday.
The United States (US) carried out strikes against Iran for the twelfth consecutive night, while Tehran retaliated by targeting US military bases in Jordan and Bahrain.
Oil supply disruptions around the Strait of Hormuz have now spread to the Bab el-Mandeb Strait after Yemen’s Houthis attacked two Saudi Oil tankers in the Red Sea.
The latest flare-up pushed West Texas Intermediate (WTI) crude to its highest level since June 11, trading near $89.50 per barrel at the time of writing, up around 28% so far this month.
The rise in energy costs is adding to inflation concerns and strengthening expectations that the Federal Reserve (Fed) may need to raise interest rates later this year.
Markets are now pricing in a higher probability of a Fed rate hike at the September meeting, with the odds standing at 78%, up from 52% a week ago, according to the CME FedWatch Tool.
As a result, traders appear reluctant to build aggressive bullish positions in Gold, which continues to face headwinds from hawkish Fed expectations, a broadly stronger US Dollar and elevated US Treasury yields.
The benchmark 10-year US Treasury yield trades around 4.64%, its highest level since May 20. Higher yields tend to weigh on Gold by increasing the appeal of interest-bearing assets.
TD Securities warns that "the higher rate environment suggests that the yellow metal may again be destined to drop back to support at around $3,900/oz, before any new highs occur some twelve months from now."
Technical analysis: $4,200 remains the key hurdle
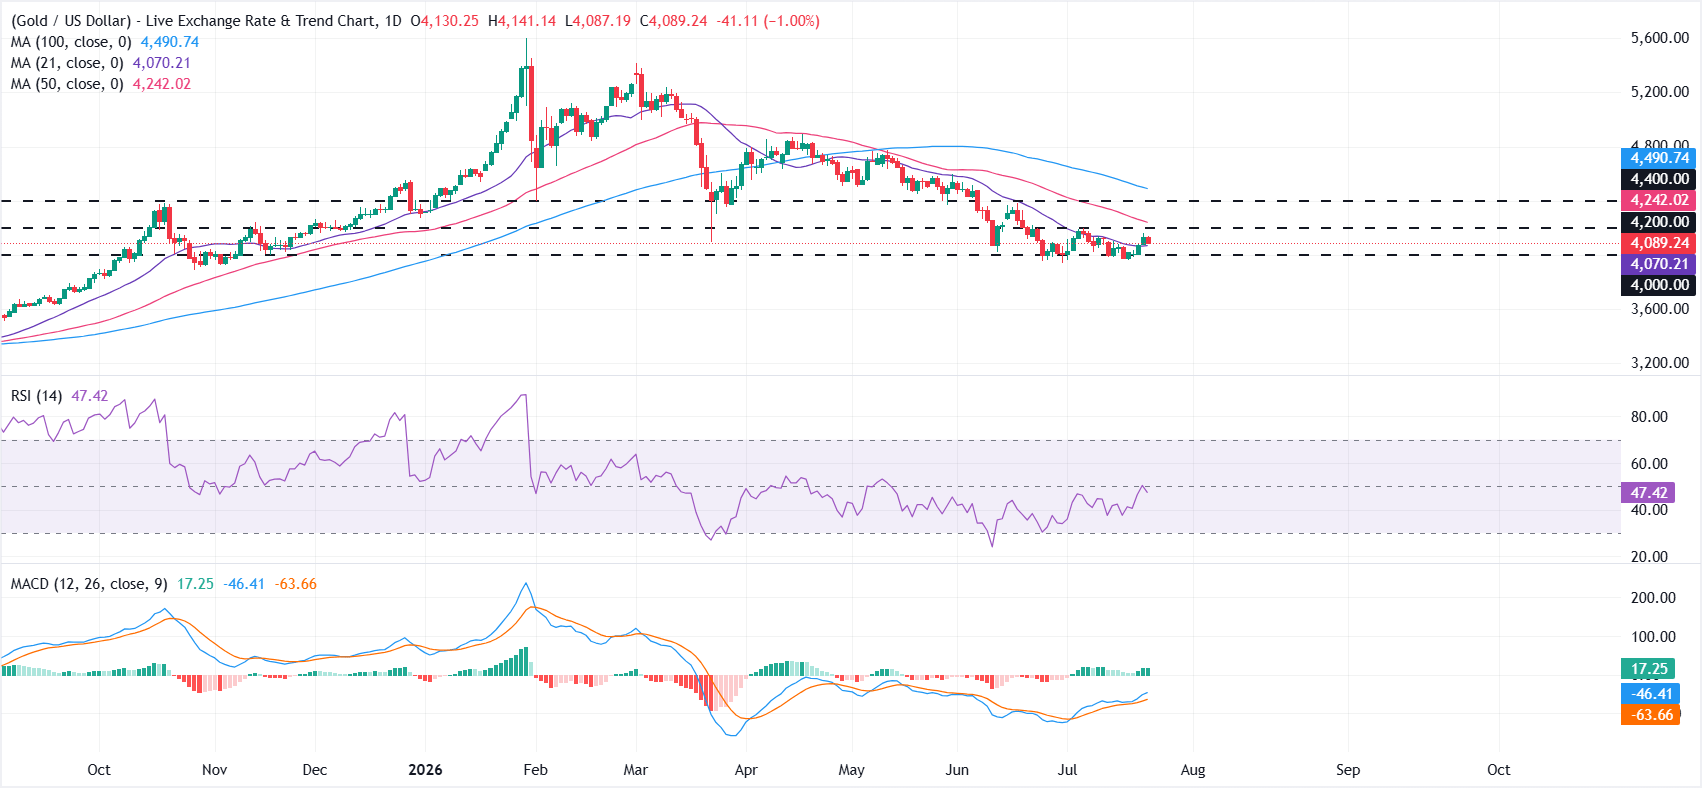
On the daily chart, XAU/USD holds above the 21-day Simple Moving Average (SMA) at $4,070 but stays below the 50-day and 100-day SMAs, leaving the near-term outlook neutral.
The nearby horizontal barrier at $4,200 reinforces this overhead supply, suggesting that bulls need a decisive push through this cluster to regain clearer control.
The Relative Strength Index (RSI) around 47 stays near its midline, hinting at balanced momentum, while the Moving Average Convergence Divergence (MACD) indicator remains positive, which modestly favors consolidation with a slight upside tilt rather than outright trend.
On the topside, initial resistance is located at the horizontal level of $4,200, followed by the 50-day SMA at $4,242. A daily close above these would open the way toward the next hurdle at $4,400 and the longer-term cap at the 100-day SMA near $4,490.
On the downside, immediate support is seen at the short-term floor around the 21-day SMA at $4,070, followed by the psychological $4,000 mark. A break below this latter level would expose deeper retracement risk despite the current neutral bias.
(The technical analysis of this story was written with the help of an AI tool. Know more.)
Gold FAQs
Gold has played a key role in human’s history as it has been widely used as a store of value and medium of exchange. Currently, apart from its shine and usage for jewelry, the precious metal is widely seen as a safe-haven asset, meaning that it is considered a good investment during turbulent times. Gold is also widely seen as a hedge against inflation and against depreciating currencies as it doesn’t rely on any specific issuer or government.
Central banks are the biggest Gold holders. In their aim to support their currencies in turbulent times, central banks tend to diversify their reserves and buy Gold to improve the perceived strength of the economy and the currency. High Gold reserves can be a source of trust for a country’s solvency. Central banks added 1,136 tonnes of Gold worth around $70 billion to their reserves in 2022, according to data from the World Gold Council. This is the highest yearly purchase since records began. Central banks from emerging economies such as China, India and Turkey are quickly increasing their Gold reserves.
Gold has an inverse correlation with the US Dollar and US Treasuries, which are both major reserve and safe-haven assets. When the Dollar depreciates, Gold tends to rise, enabling investors and central banks to diversify their assets in turbulent times. Gold is also inversely correlated with risk assets. A rally in the stock market tends to weaken Gold price, while sell-offs in riskier markets tend to favor the precious metal.
The price can move due to a wide range of factors. Geopolitical instability or fears of a deep recession can quickly make Gold price escalate due to its safe-haven status. As a yield-less asset, Gold tends to rise with lower interest rates, while higher cost of money usually weighs down on the yellow metal. Still, most moves depend on how the US Dollar (USD) behaves as the asset is priced in dollars (XAU/USD). A strong Dollar tends to keep the price of Gold controlled, whereas a weaker Dollar is likely to push Gold prices up.
Recommended Articles


