


USD/CHF Price Forecast: Holds below 0.8320 as the Swissie withstands bonds selloff
- USD/CHF rallies remain capped below 0.8320, with the Swiss Franc supported amid the global debt turmoil.
- Switzerland's sound fiscal health is boosting the Swiss Franc's recovery in October.
- The pair remains vulnerable, while below 0.8320.
The Swiss Franc (CHF) has retraced previous losses on Monday and trades practically flat against the US Dollar (USD), hardly affected by the bond market turmoil that has crushed investors’ appètite for risk. The USD/CHF pair bounced from 0.8225 lows on Friday but has been contained below a previous support area around 0.8320, which keeps the immediate bearish trend in place.
US labour market data disappointed on Friday as Nonfarm Payrolls grew well below forecasts and the unemployment rate increased unexpectedly in September, curbing hopes of a Federal Reserve (Fed) interest rate hike in October. The US Dollar, however, trimmed losses on Monday’s early trading as the global bonds’ selloff deepened, and boosted demand for safe-haven assets.
In this context, the Swiss Franc remains fairly steady, supported by sound Swiss fiscal health, as Swiss public debt remains at a mere 19% of GDP, compared with the approximately 127% in the US, France's 115% or Japan’s 250% ratios. This is offsetting the adverse monetary policy divergence between the Fed and the Swiss National Bank, which sent the CHF nearly 5% down against the US Dollar in the previous two months.
Technical Analysis: Resistance at 0.8320 keeps the immediate bearish trend in play
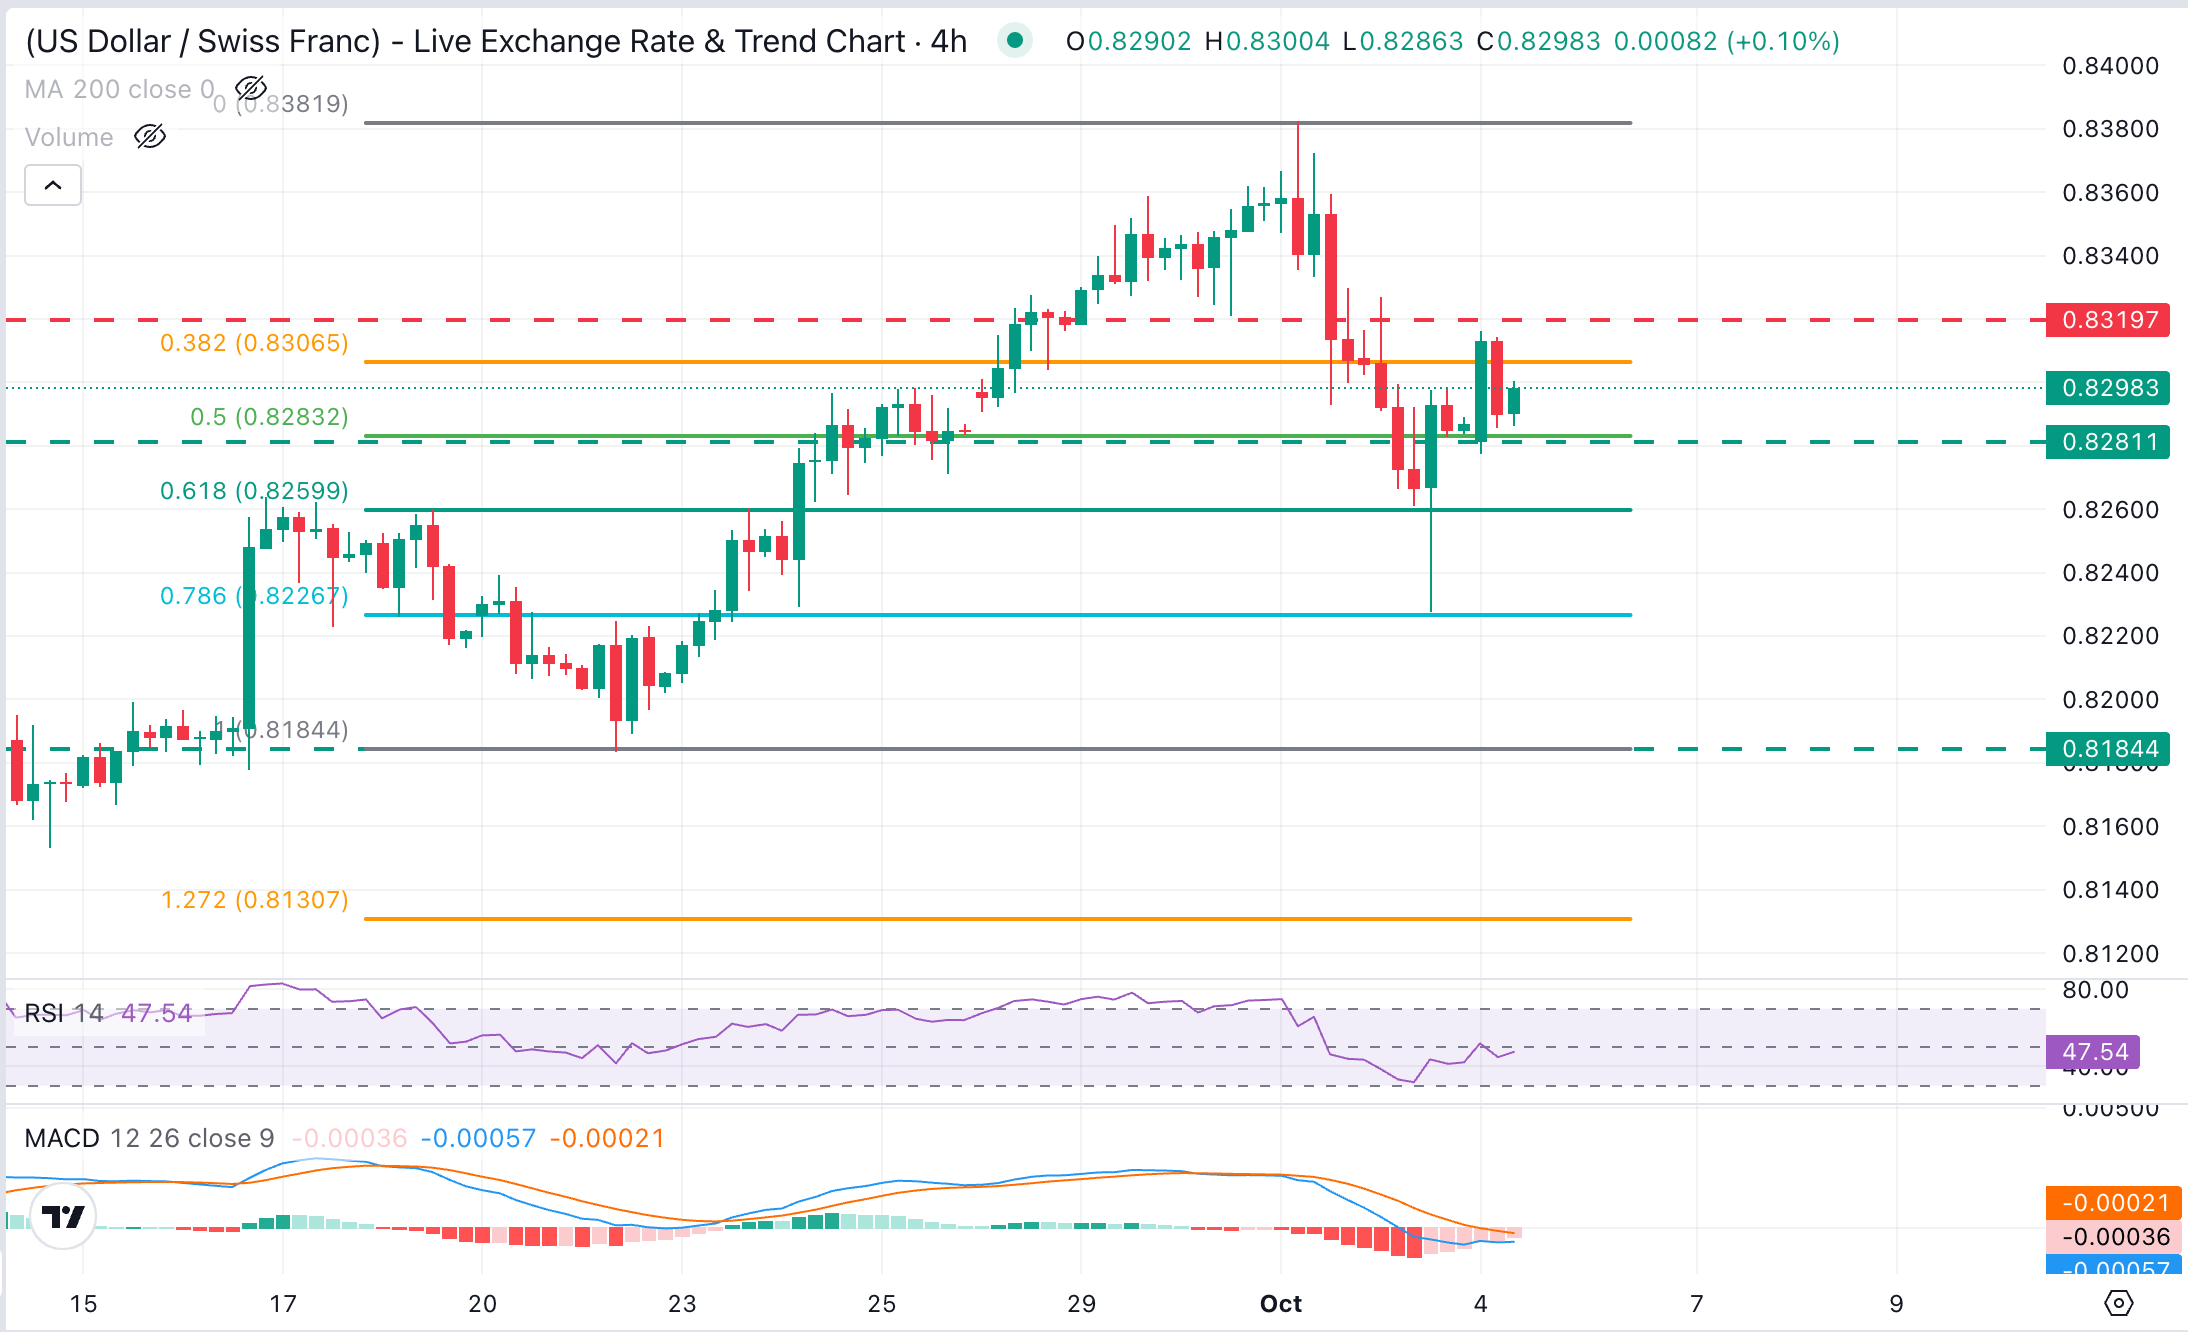
USD/CHF trades just below 0.8300 as the US Dollar's recovery from Friday's low, at 0.8225, has failed to find acceptance above a previous support area around 0.8320. Momentum indicators in the 4-hour chart are neutral-to-negative, with the Relative Strength Index (14) just below the midline, and the Moving Average Convergence Divergence (MACD) slightly negative, suggesting that upside attempts could stay limited.
Bulls need to clear the mentioned 0.8320 (intra-day high, September 30 low) to shrug off the immediate bearish pressure and clear the way towards the 17-month high, at the 0.8380 area hit in September. On the downside, a confirmation below session lows at the 0.8280 area would expose the September 24 and October 2 lows, which is also the 78.6% Fibonacci retracement of the late-September upleg, at 0.8225, a key level for bears.
(The technical analysis of this story was written with the help of an AI tool. Know more.)
Swiss Franc Price Today
The table below shows the percentage change of Swiss Franc (CHF) against listed major currencies today. Swiss Franc was the strongest against the Euro.
| USD | EUR | GBP | JPY | CAD | AUD | NZD | CHF | |
|---|---|---|---|---|---|---|---|---|
| USD | 0.48% | 0.13% | 0.06% | 0.00% | -0.23% | 0.51% | 0.17% | |
| EUR | -0.48% | -0.31% | -0.37% | -0.45% | -0.53% | -0.04% | -0.27% | |
| GBP | -0.13% | 0.31% | -0.06% | -0.13% | -0.21% | 0.28% | 0.05% | |
| JPY | -0.06% | 0.37% | 0.06% | -0.09% | -0.22% | 0.32% | 0.10% | |
| CAD | 0.00% | 0.45% | 0.13% | 0.09% | -0.12% | 0.38% | 0.15% | |
| AUD | 0.23% | 0.53% | 0.21% | 0.22% | 0.12% | 0.49% | 0.27% | |
| NZD | -0.51% | 0.04% | -0.28% | -0.32% | -0.38% | -0.49% | -0.23% | |
| CHF | -0.17% | 0.27% | -0.05% | -0.10% | -0.15% | -0.27% | 0.23% |
The heat map shows percentage changes of major currencies against each other. The base currency is picked from the left column, while the quote currency is picked from the top row. For example, if you pick the Swiss Franc from the left column and move along the horizontal line to the US Dollar, the percentage change displayed in the box will represent CHF (base)/USD (quote).
Recommended Articles


