


AUD/USD Price Forecast: Surging US bond yields warrant downside
- The Australian Dollar edges up to around 0.6976 against the US Dollar; the outlook remains uncertain.
- Surging oil prices have revived hawkish Fed interest rate prospects.
- Preliminary Australian S&P Global PMI arrives higher at 52.6 in July.
The Australian Dollar (AUD) trades marginally higher at around 0.6976 against the US Dollar (USD) during the European trading session on Friday. The Aussie pair edges up, but is broadly weak, as surging US Treasury yields due to the revival of hawkish Federal Reserve (Fed) interest rate expectations dampens investors’ risk appetite.
As of writing, 10-year US Treasury Yields trade firmly at around 4.70%, the highest level seen in over 18 months. S&P 500 futures trade cautiously near Thursday’s low at around 7,404, reflecting a risk-off market mood.
According to the CME FedWatch tool, the odds of the Fed delivering an interest rate hike in the policy meeting next week stand at 33.7%, significantly higher than 11.8% recorded last week. Fed’s interest rate hike prospects were also higher at around 34% a month ago, but they eased later after the release of the soft US Consumer Price Index (CPI) data for June.
Surging oil prices due to risks of a prolonged closure of the Strait of Hormuz and the Bab el-Mandeb Strait, critical chokepoints that are collectively responsible for 27% of global energy supply, have boosted inflation projections, a scenario that forces central banks to advocate tight monetary conditions.
Higher US bond yields have also strengthened the US Dollar. At press time, the US Dollar index (DXY), which tracks the Greenback’s value against six major currencies, trades firmly near the three-week high at around 101.50.
On the domestic front, Australian employment data for June and the flash S&P Global Purchasing Managers’ Index (PMI) data for July have come in stronger.
On Thursday, the labor market report showed that the economy created 76.3K fresh jobs, significantly higher than 44K in May. Earlier in the day, Australian Composite PMI arrived at 52.6, higher than 50.4 in June.
AUD/USD technical analysis
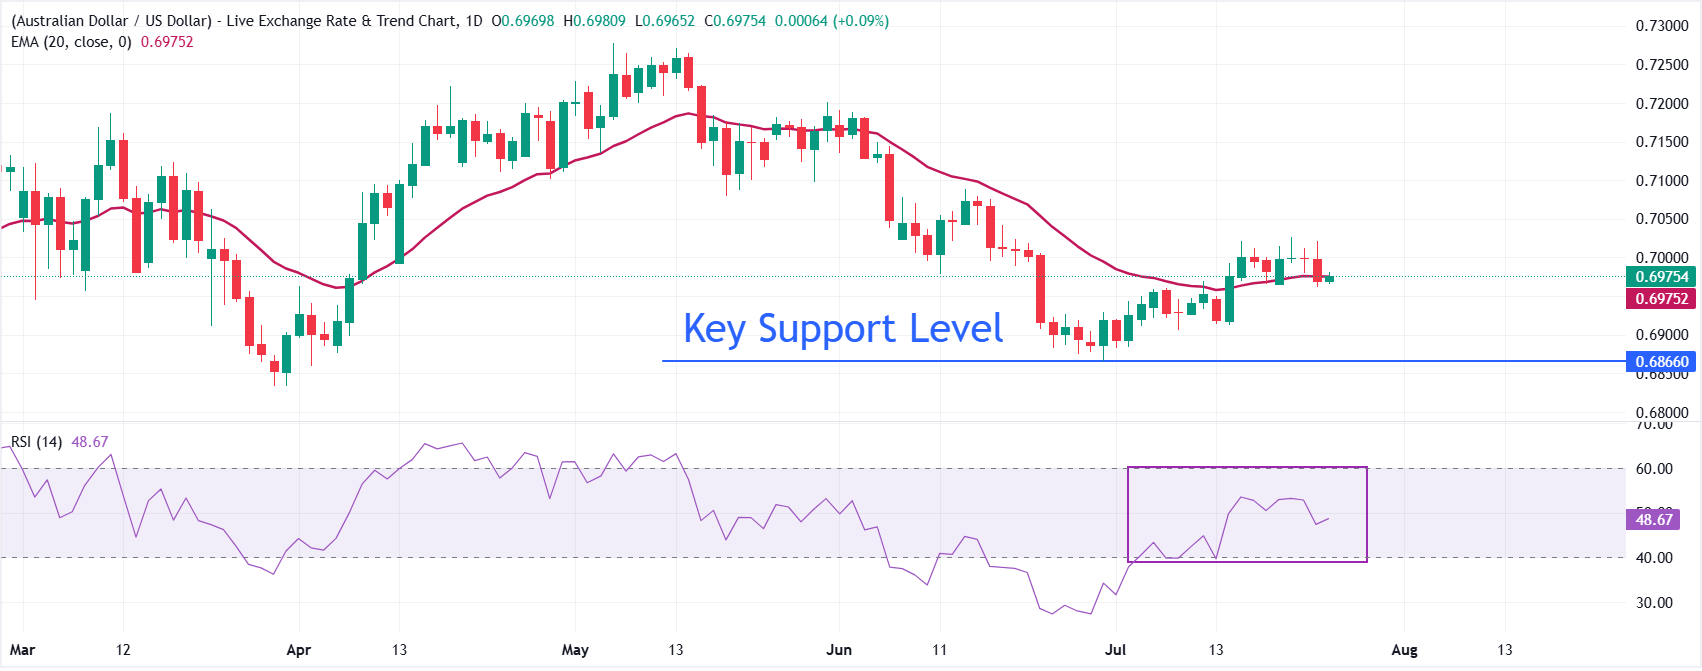
AUD/USD trades marginally higher at 0.6975, hovering right on the 20-period exponential moving average (EMA) at 0.6975, which acts as a pivotal line for the near-term trend.
The pair is consolidating after recovering from late-January lows, and the neutral stance is reinforced by the Relative Strength Index (RSI) holding just below the 50 mark around 49, hinting at balanced but still fragile momentum.
The Aussie pair might see a fresh upside towards 0.7100 if it breaks above the July 21 high at 0.7027. Looking down, the pair would be exposed to the June 30 low at 0.6865 once it breaks below the July 14 low at 0.6913
(The technical analysis of this story was written with the help of an AI tool. Know more.)
Economic Indicator
S&P Global Composite PMI
The Composite Purchasing Managers Index (PMI), released on a monthly basis by S&P Global, is a leading indicator gauging private-business activity in Australia for both the manufacturing and services sectors. The data is derived from surveys to senior executives. Each response is weighted according to the size of the company and its contribution to total manufacturing or services output accounted for by the sub-sector to which that company belongs. Survey responses reflect the change, if any, in the current month compared to the previous month and can anticipate changing trends in official data series such as Gross Domestic Product (GDP), industrial production, employment and inflation. The index varies between 0 and 100, with levels of 50.0 signaling no change over the previous month. A reading above 50 indicates that the Australian private economy is generally expanding, a bullish sign for the Australian Dollar (AUD). Meanwhile, a reading below 50 signals that activity is generally declining, which is seen as bearish for AUD.
Read more.Last release: Thu Jul 23, 2026 23:00 (Prel)
Frequency: Monthly
Actual: 52.6
Consensus: -
Previous: 50.4
Source: S&P Global
Recommended Articles


