

EUR/USD Price Forecast: Approaches 1.1600 as RSI shifts bullish

Source Fxstreet
  • EUR/USD trades near 19-day highs despite broader bearish bias.
  • RSI turns bullish, signaling buyers are gaining recovery momentum
  • Break above 1.1500 exposes 1.1542 and 1.1592 resistance.

The EUR/USD advances some 0.41% on Wednesday, trading at 1.1466 after US inflation data was softer than expected, weighing on the Greenback, as market participants expect a less hawkish Federal Reserve. Towards the end of the year.

EUR/USD Price Forecast: Technical outlook

From a technical perspective, the EUR/USD is downwardly biased, even though it trades near 19-day highs. Momentum turned bullish, as indicated by the Relative Strength Index (RSI), which could open the door to a recovery, with buyers eyeing key technical resistance levels.

The first resistance for EUR/USD is the psychological 1.1500 level. Above lies the 50-day Simple Moving Average (SMA) at 1.1542, followed by the 100-day SMA at 1.1592 ahead of the 1.1600 mark. Upwards lies the 200-day SMA at 1.1642.

On the other hand, if EUR/USD dives below 1.1400, the next support would be the July 13 low of 1.1377. On further weakness, the next support would be the June 24 daily low at 1.1324, ahead of 1.1300.

EUR/USD Price Chart — Daily
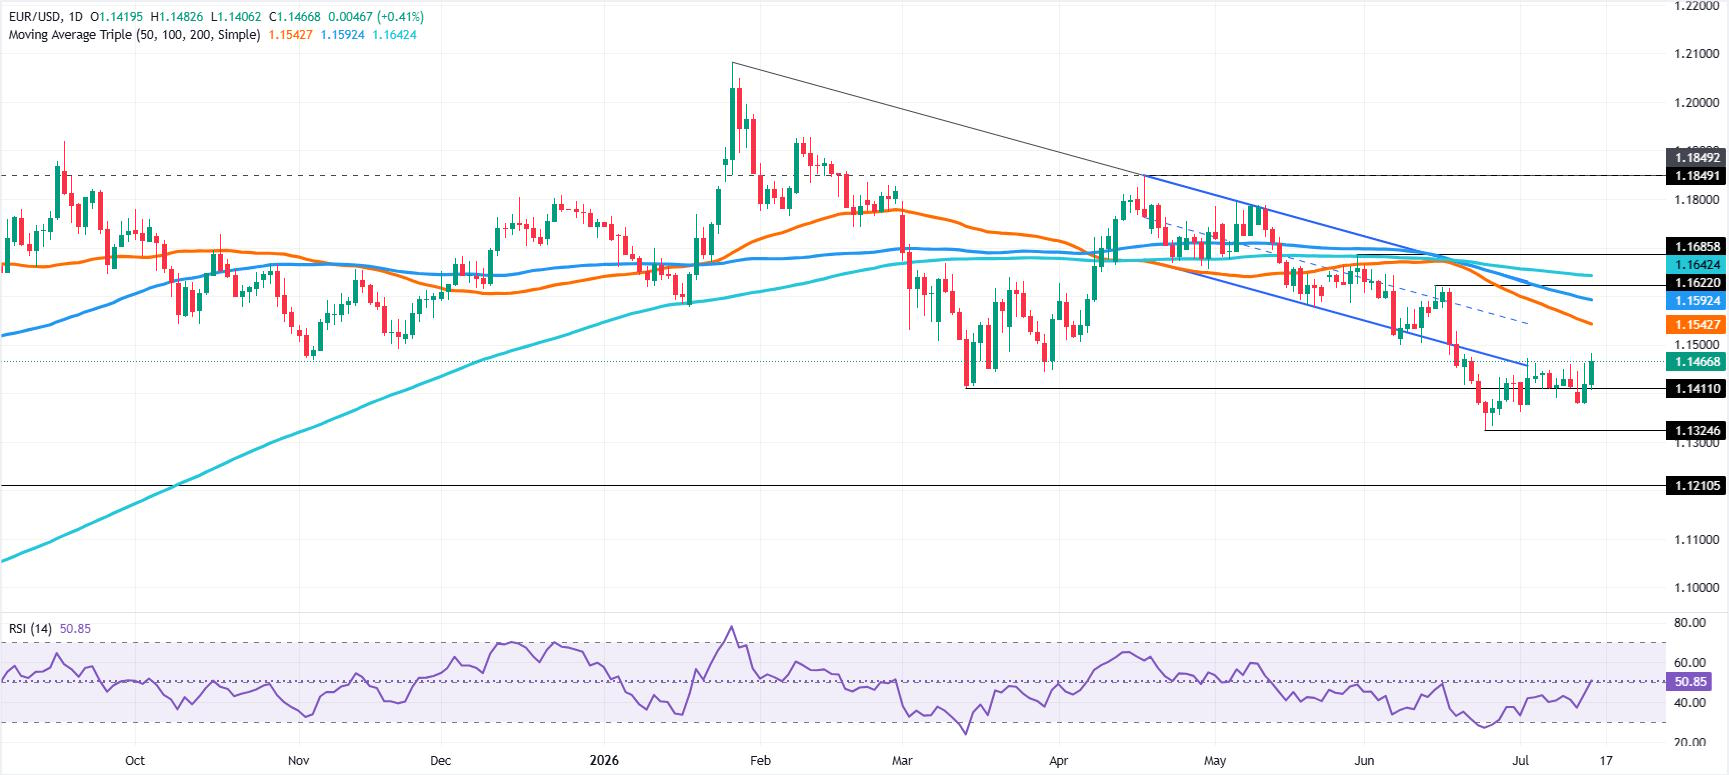
EUR/USD daily chart

Euro Price This week

The table below shows the percentage change of Euro (EUR) against listed major currencies this week. Euro was the strongest against the Japanese Yen.

USD EUR GBP JPY CAD AUD NZD CHF
USD -0.56% -1.10% 0.19% -0.83% -0.86% -1.47% -0.36%
EUR 0.56% -0.56% 0.80% -0.27% -0.35% -0.92% 0.22%
GBP 1.10% 0.56% 1.29% 0.29% 0.20% -0.40% 0.81%
JPY -0.19% -0.80% -1.29% -1.12% -1.07% -1.72% -0.62%
CAD 0.83% 0.27% -0.29% 1.12% 0.06% -0.61% 0.53%
AUD 0.86% 0.35% -0.20% 1.07% -0.06% -0.57% 0.47%
NZD 1.47% 0.92% 0.40% 1.72% 0.61% 0.57% 1.19%
CHF 0.36% -0.22% -0.81% 0.62% -0.53% -0.47% -1.19%

The heat map shows percentage changes of major currencies against each other. The base currency is picked from the left column, while the quote currency is picked from the top row. For example, if you pick the Euro from the left column and move along the horizontal line to the US Dollar, the percentage change displayed in the box will represent EUR (base)/USD (quote).

Disclaimer: For information purposes only. Past performance is not indicative of future results.
placeholder
Market Flash: Oil Surges 5% on Israel-Iran Strikes, Gold Crumbles Below $4,300 Oil prices surged 5% following direct Israel-Iran strikes, while gold tumbled below $4,300 as a blowout U.S. jobs report fueled intense market anxieties over a December Federal Reserve rate hike.
Author  Mitrade Team
6 Month 09 Day Tue
Oil prices surged 5% following direct Israel-Iran strikes, while gold tumbled below $4,300 as a blowout U.S. jobs report fueled intense market anxieties over a December Federal Reserve rate hike.
placeholder
Gold Price Analysis (XAU/USD): Gold Falls to 6-Month Low as Inflation Fuels Rate Hike Bets, A Buying Opportunity or a Falling Knife? Gold hit a 6-month low on Fed rate hike bets. However, strong central bank buying and technical indicators suggest potential tactical bounces and long-term accumulation windows.
Author  Mitrade Team
6 Month 12 Day Fri
Gold hit a 6-month low on Fed rate hike bets. However, strong central bank buying and technical indicators suggest potential tactical bounces and long-term accumulation windows.
placeholder
XRP Price Prediction for July 2026: Can Buyers Finally Break the Downtrend?XRP (XRP) price trades near $1.05, caught between a year-long downtrend and a sudden burst of buying.July has historically rewarded XRP holders. This year the month arrives with on-chain accumulation
Author  Beincrypto
6 Month 30 Day Tue
XRP (XRP) price trades near $1.05, caught between a year-long downtrend and a sudden burst of buying.July has historically rewarded XRP holders. This year the month arrives with on-chain accumulation
placeholder
Smart Money is Leaving Nvidia for This AI Chip StockNvidia stock price keeps sliding, yet the usual dip buyers are missing. Institutional money flow on the stock is the most negative of any major chip name, which means big investors are stepping back i
Author  Beincrypto
6 Month 30 Day Tue
Nvidia stock price keeps sliding, yet the usual dip buyers are missing. Institutional money flow on the stock is the most negative of any major chip name, which means big investors are stepping back i
placeholder
What to Expect From Ethereum (ETH) in July 2026Ethereum (ETH) enters July 2026 trading near $1,570, close to multi-month lows, after recording its first run of three consecutive red quarterly candles in its history.On-chain data and price charts n
Author  Beincrypto
7 Month 01 Day Wed
Ethereum (ETH) enters July 2026 trading near $1,570, close to multi-month lows, after recording its first run of three consecutive red quarterly candles in its history.On-chain data and price charts n
Related Instrument
goTop
quote