

USD/CAD Price Forecast: Further correction to 20-day EMA might create buying opportunity
- USD/CAD trades subduedly near 1.4175 as the US Dollar faces selling pressure.
- Traders trim hawkish Fed bets, following the release of the weak US NFP data for June.
- Lower oil prices continue to keep the Canadian Dollar on the back foot.
The USD/CAD pair reflects a subdued performance near 1.4175 during the European trading session on Friday. The Loonie pair edges lower as the US Dollar (USD) faces selling pressure due to easing hawkish Federal Reserve (Fed) prospects.
In the European trade, the US Dollar Index (DXY), which tracks the Greenback’s value against six major currencies, trades 0.14% lower to near 100.70.
Weak US Nonfarm Payrolls (NFP) data for June has forced traders to reconsider hawkish Fed interest rate expectations. The data showed on Thursday that the economy created 57K fresh jobs in June, fewer than 110K estimates.
Going forward, investors will focus on the US ISM Services PMI data for June, which will be released on Friday.
On the Canadian Dollar (CAD) front, the currency has remained under pressure as oil prices have returned to pre-Middle East war levels, given that Canada is a net oil exporter. Oil prices have faced pressure as Oman has touted progress in indirect talks between the US and Iran.
USD/CAD technical analysis
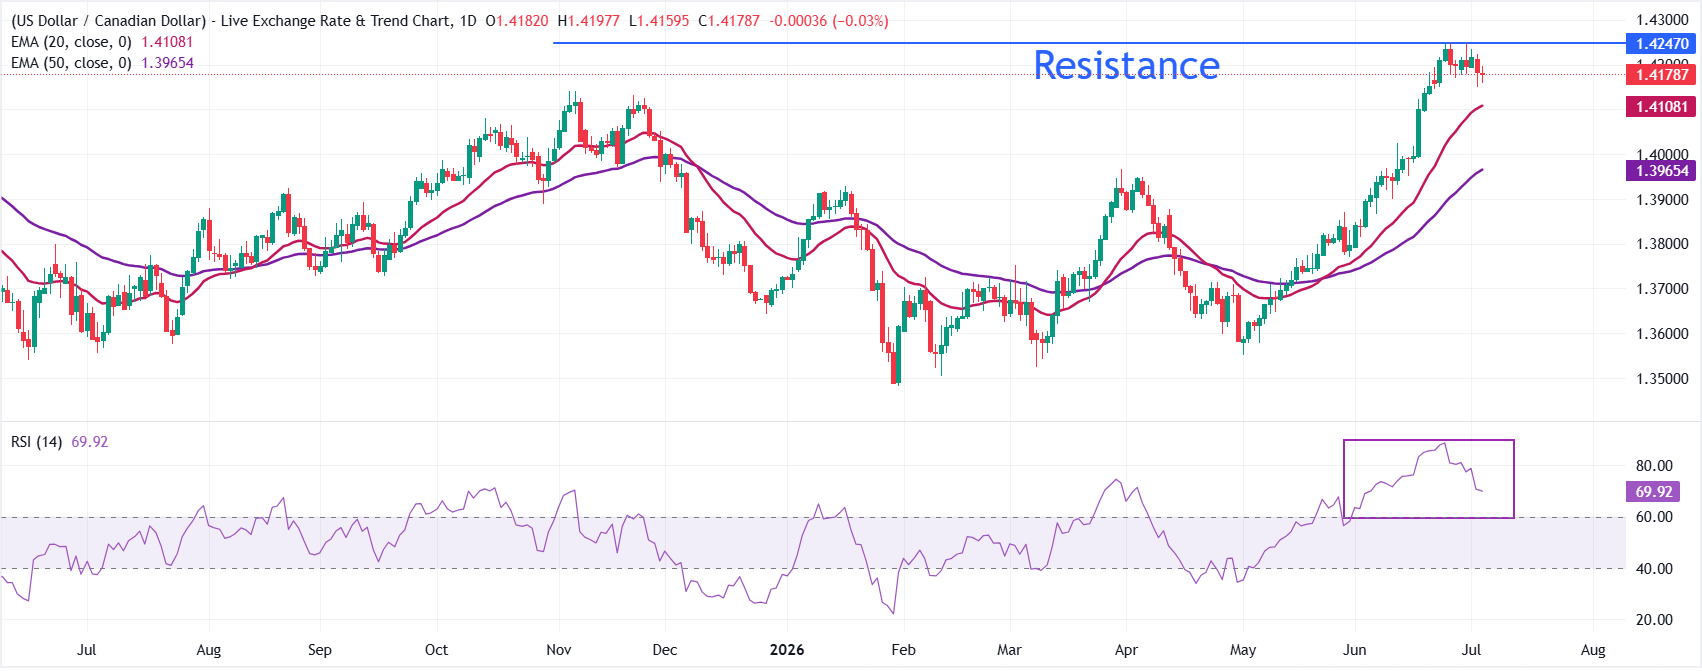
USD/CAD edges lower to near 1.4179, but holds a clear bullish bias as price sits above both the 20-day and 50-day exponential moving averages (EMAs). The 20-day EMA at 1.4108 and the 50-day EMA at 1.3965 reinforce an underlying uptrend, while the Relative Strength Index (14), hovering just below the overbought region around 70, suggests persistent but stretched upside momentum.
On the downside, the pair could extend its correction to the 20-day EMA near 1.4110 as the US Dollar is under pressure. Given that the broader outlook is bullish, the odds are high that the correction move near the 20-day EMA would offer a buying opportunity to investors. On the upside, the pair could regain strength if it manages to break above the June 24 high at 1.4248; above that, the pair could extend its advance towards 1.4300.
(The technical analysis of this story was written with the help of an AI tool.)
Economic Indicator
Nonfarm Payrolls
The Nonfarm Payrolls release presents the number of new jobs created in the US during the previous month in all non-agricultural businesses; it is released by the US Bureau of Labor Statistics (BLS). The monthly changes in payrolls can be extremely volatile. The number is also subject to strong reviews, which can also trigger volatility in the Forex board. Generally speaking, a high reading is seen as bullish for the US Dollar (USD), while a low reading is seen as bearish, although previous months' reviews and the Unemployment Rate are as relevant as the headline figure. The market's reaction, therefore, depends on how the market assesses all the data contained in the BLS report as a whole.
Read more.Last release: Thu Jul 02, 2026 12:30
Frequency: Monthly
Actual: 57K
Consensus: 110K
Previous: 172K
Source: US Bureau of Labor Statistics
America’s monthly jobs report is considered the most important economic indicator for forex traders. Released on the first Friday following the reported month, the change in the number of positions is closely correlated with the overall performance of the economy and is monitored by policymakers. Full employment is one of the Federal Reserve’s mandates and it considers developments in the labor market when setting its policies, thus impacting currencies. Despite several leading indicators shaping estimates, Nonfarm Payrolls tend to surprise markets and trigger substantial volatility. Actual figures beating the consensus tend to be USD bullish.
Recommended Articles


