

Indian Rupee gains ground as weak NFP data batters US Dollar
- The Indian Rupee opens on a slight positive note due to the US Dollar’s broader underperformance.
- Weak US NFP data weighs on the US Dollar.
- Lower oil prices will continue to offer support to the US Dollar.
The Indian Rupee (INR) opens slightly higher against the US Dollar (USD) on Friday. The USD/INR pair drops to near 95.26 due to broader underperformance in the US Dollar, following the release of the weak United States (US) Nonfarm Payrolls (NFP) data for June on Thursday.
As of writing, the US Dollar Index (DXY), which tracks the Greenback’s value against six major currencies, trades marginally lower to near 100.78. On Thursday, the USD Index declined almost 0.6% from Wednesday’s closing price.
US NFP report shows moderate labor demand
The US NFP report showed that employers hired 57K fresh jobs in June, significantly lower than estimates of 110K. Also, the May data was revised lower to 129K from 172K. The Unemployment Rate dropped to 4.2% against the estimates and the previous reading of 4.3%.
Average Hourly Earnings, a key measure of wage growth, rose by 3.5% Year-on-Year (YoY), as expected, faster than the previous reading of 3.4%.
Signs of soft job demand have forced traders to reconsider hawkish Federal Reserve (Fed) interest rate expectations. Following the US official employment data release, the odds of the Fed delivering at least one interest rate hike in the September policy meeting have diminished to 53.2% from almost 64% seen on Wednesday, according to the CME FedWatch tool.
Considering the latest remarks from Fed officials that their majority priority is taming “high inflation”. On Wednesday, Fed Chair Kevin Warsh warned at the European Central Bank (ECB) Forum in Sintra that inflation remains “too high”, while stressing the need to bring price stability. As expected, Warsh didn't offer any cues regarding the Fed’s future decisions on interest rates.
Oil prices stabilize near pre-Middle East war levels
The MCX Crude Oil contract expiring on July 20 appears to have stabilized in the 6,450-6,600 range after falling over 20% in June. Oil prices will likely remain near pre-Middle East war levels, as Qatar has touted “progress” in indirect talks between the US and Iran.
Lower oil prices bode well for currencies from economies, such as India that rely heavily on oil imports to meet their energy needs.
FIIs continue to dump stake in Indian stock market
Foreign Institutional Investors (FIIs) have remained net sellers in the first two trading days of July, offloading their stake worth Rs. 1.452.32 crore. However, the amount of selling has declined as oil prices have returned lower, with investors focusing on business updates from financial services and consumption companies of India Inc.
Technical Analysis: USD/INR holds above 20-day EMA
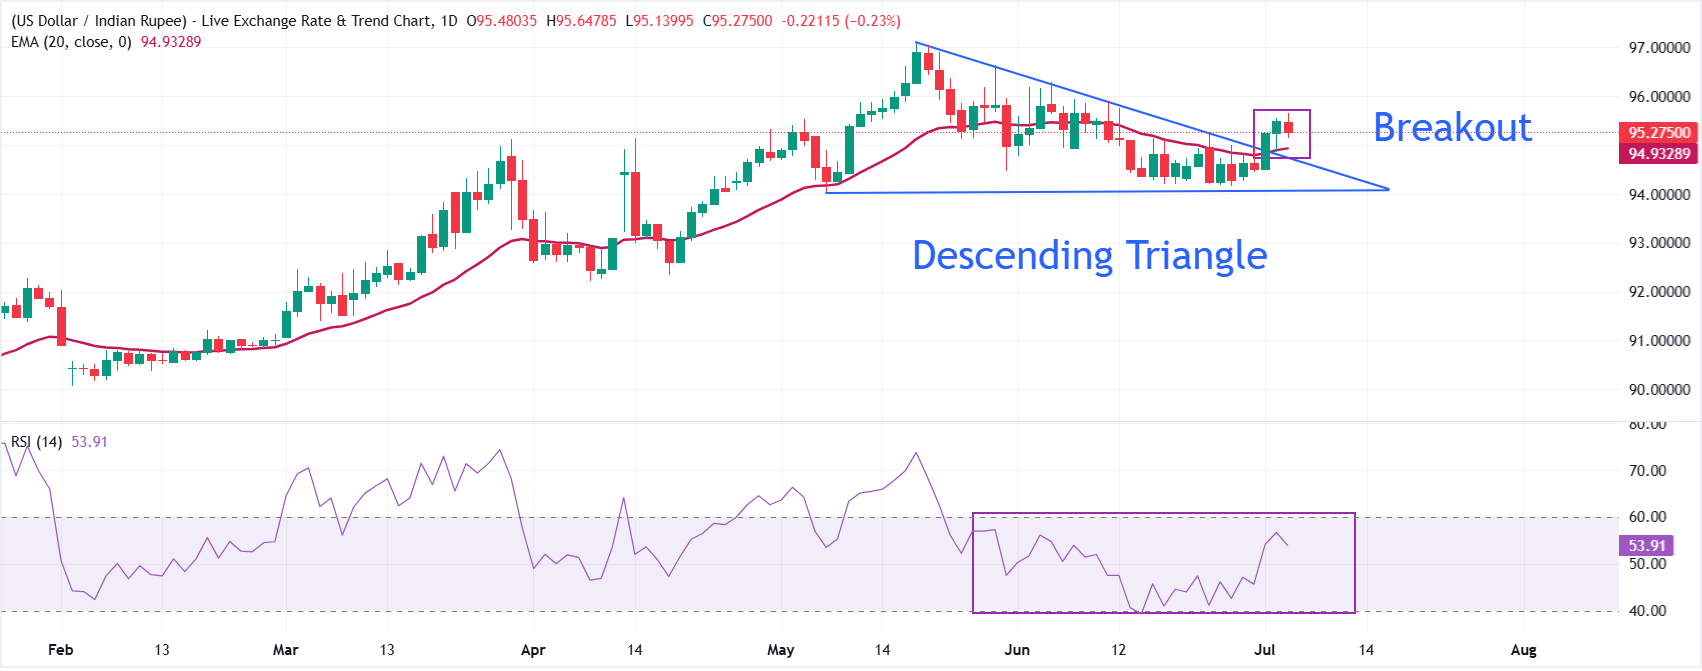
USD/INR trades at around 95.26, holding a modest bullish bias as it consolidates above the 20-day Exponential Moving Average (EMA) at roughly 94.93 and the breakout of the Descending Triangle formation.
The Relative Strength Index (RSI) at around 54 suggests mildly positive, but not overstretched, momentum.
On the downside, initial support is seen at the 20-day EMA near 94.933, reinforced by the reclaimed downward trend-line region around 94.764, with deeper protection at the structural support zone near 94.065. Looking down, the pair could extend its advance towards 96.00 if it continues to hold the Descending Triangle breakout.
(The technical analysis of this story was written with the help of an AI tool.)
Indian Rupee FAQs
The Indian Rupee (INR) is one of the most sensitive currencies to external factors. The price of Crude Oil (the country is highly dependent on imported Oil), the value of the US Dollar – most trade is conducted in USD – and the level of foreign investment, are all influential. Direct intervention by the Reserve Bank of India (RBI) in FX markets to keep the exchange rate stable, as well as the level of interest rates set by the RBI, are further major influencing factors on the Rupee.
The Reserve Bank of India (RBI) actively intervenes in forex markets to maintain a stable exchange rate, to help facilitate trade. In addition, the RBI tries to maintain the inflation rate at its 4% target by adjusting interest rates. Higher interest rates usually strengthen the Rupee. This is due to the role of the ‘carry trade’ in which investors borrow in countries with lower interest rates so as to place their money in countries’ offering relatively higher interest rates and profit from the difference.
Macroeconomic factors that influence the value of the Rupee include inflation, interest rates, the economic growth rate (GDP), the balance of trade, and inflows from foreign investment. A higher growth rate can lead to more overseas investment, pushing up demand for the Rupee. A less negative balance of trade will eventually lead to a stronger Rupee. Higher interest rates, especially real rates (interest rates less inflation) are also positive for the Rupee. A risk-on environment can lead to greater inflows of Foreign Direct and Indirect Investment (FDI and FII), which also benefit the Rupee.
Higher inflation, particularly, if it is comparatively higher than India’s peers, is generally negative for the currency as it reflects devaluation through oversupply. Inflation also increases the cost of exports, leading to more Rupees being sold to purchase foreign imports, which is Rupee-negative. At the same time, higher inflation usually leads to the Reserve Bank of India (RBI) raising interest rates and this can be positive for the Rupee, due to increased demand from international investors. The opposite effect is true of lower inflation.
Recommended Articles


