


WTI (USOIL) Is down by 5.97% on Jul 27: Is the Demand Outlook Changing?
WTI (USOIL) is down 5.97% at Jul 27 00:00(ET), now at $84.667, with a 7-day up of 2.75%.
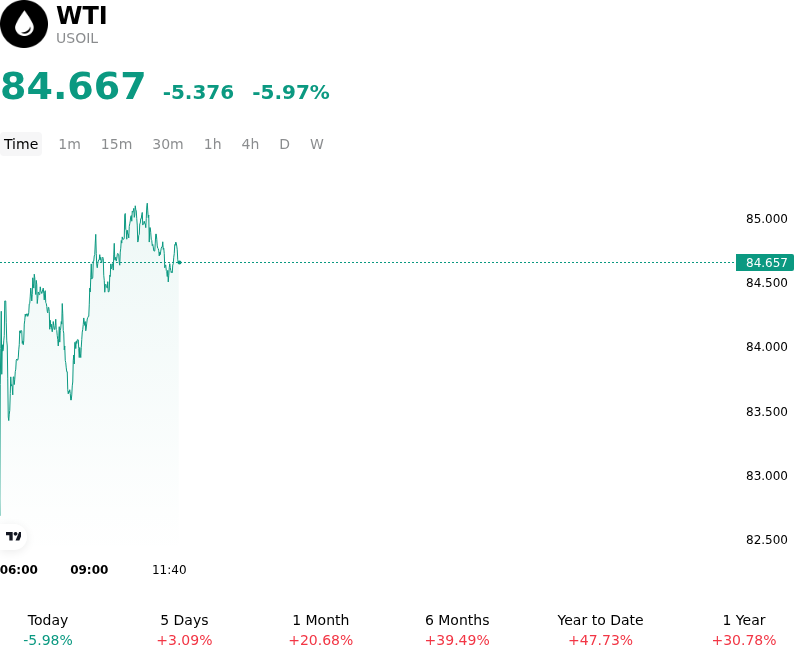
What is driving WTI (USOIL)’s stock price down today?
The sharp decline in WTI crude prices is primarily driven by a fundamental shift in OPEC+ production strategy and deteriorating demand signals from major global consumers. Reports emerging from recent ministerial discussions indicate a growing consensus among core members to accelerate the unwinding of voluntary production cuts starting in the fourth quarter. This shift toward a volume-over-price strategy suggests that the alliance is increasingly concerned with maintaining market share in the face of persistent output growth from non-OPEC producers, particularly in the Americas. This perceived change in policy has effectively removed the floor from the market, as investors recalibrate the expected global supply-demand balance for the remainder of the year.
Demand-side pressures have intensified following a series of disappointing economic indicators from China, where refinery throughput and industrial activity have failed to meet seasonal expectations. The lack of robust stimulus measures to support the manufacturing sector has led to a significant downward revision in crude consumption forecasts for the world’s largest oil importer. This cooling demand environment is further reflected in recent inventory data, which showed a counter-seasonal build in commercial stockpiles, suggesting that the physical market is more oversupplied than previously anticipated.
Macroeconomic headwinds are also weighing heavily on energy complex sentiment. A strengthening US dollar, supported by hawkish guidance from Federal Reserve officials regarding the duration of elevated interest rates, has increased the cost of crude for international buyers. This currency strength, combined with a broader pivot toward risk-off sentiment in global equity markets, has prompted institutional investors to reduce their net-long positions in energy futures. The liquidation of these positions was accelerated as prices breached key technical support levels, triggering systematic selling and further exacerbating the downward momentum.
Furthermore, the erosion of the geopolitical risk premium has removed a critical pillar of support for prices. Recent progress in diplomatic negotiations in the Middle East has reduced the perceived threat to regional supply chains and transit corridors. As the likelihood of significant supply disruptions fades, market participants are shifting their focus back to the bearish structural outlook characterized by rising global inventories and weakening demand growth. The combination of these factors suggests a transition from a supply-constrained market to one defined by surplus, leading to a rapid repricing of the forward curve.
Technical Analysis of WTI (USOIL)
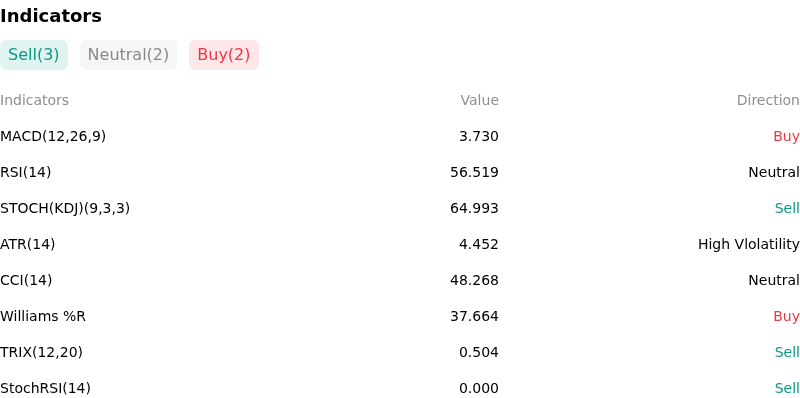
Technically, WTI (USOIL) shows a MACD (12,26,9) value of 3.726, indicating a buy signal. The RSI at 56.467 suggests neutral condition and the Williams %R at 37.802 suggests buy condition. Please monitor closely.
More details about WTI (USOIL)
Recent Events and Risks:
- Unexpected U.S. Inventory Builds: Recent EIA data reported a surprise increase in commercial crude stocks and a simultaneous rise in gasoline inventories, defying analyst expectations for a drawdown and signaling a seasonal demand lag ahead of the peak summer driving season.
- Demand Deterioration in China: Softening manufacturing PMIs and lower-than-expected refinery throughput rates in China have intensified concerns that the world's largest importer is facing a structural slump in industrial energy consumption.
- Geopolitical Risk Unwinding: Progress in diplomatic discussions regarding regional ceasefire negotiations has significantly reduced the "war premium," prompting systematic traders and hedge funds to liquidate long positions previously held as a hedge against supply shocks.
- OPEC+ Policy Uncertainty: Market participants are bracing for intraday volatility ahead of upcoming production meetings, with increased concern that the group may signal a gradual unwinding of voluntary supply cuts despite fragile global demand indicators.
Recommended Articles


