


Brent (UKOIL) Moved Sharply on Jul 24: Inventories, the Dollar, or Geopolitics?
Brent (UKOIL) is down 3.98% at Jul 24 00:00(ET), now at $93.9, with a 7-day up of 7.08%.
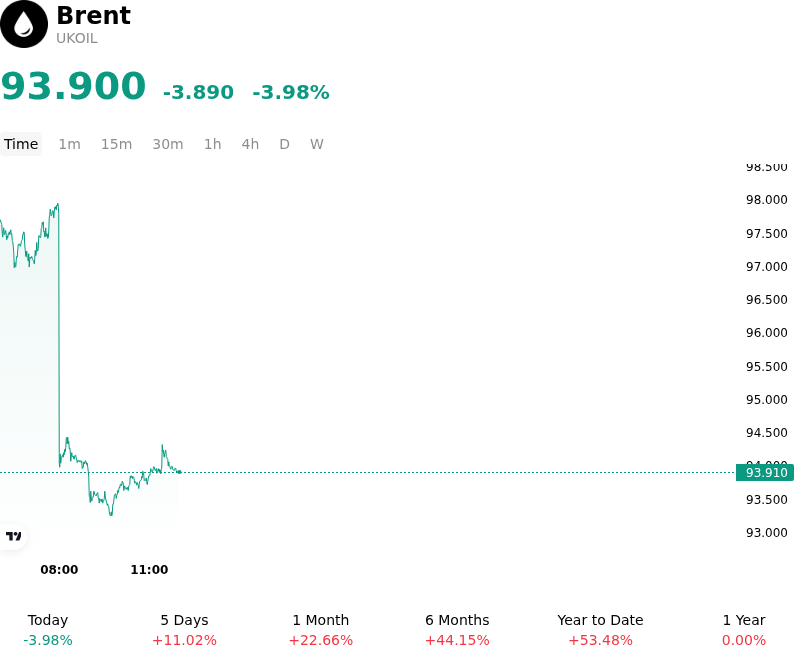
What is driving Brent (UKOIL)’s stock price down today?
The sharp decline in Brent crude is primarily driven by an accelerating narrative of demand destruction in China and a reduction in the geopolitical risk premium. As the world's largest crude importer, China's recent economic indicators have consistently disappointed market participants, with refinery throughput rates falling as industrial activity cools and the transition toward electric vehicles begins to impact fuel consumption. This structural weakness in Asian demand is significantly outweighing the seasonal peak in Western consumption, forcing a broad repricing of the global market balance for the remainder of the year.
Compounding this downward pressure is the perceived progress in diplomatic negotiations regarding conflicts in the Middle East. Institutional investors are liquidating long positions as the probability of a major supply disruption in the Persian Gulf appears to be receding. The removal of this geopolitical risk premium has triggered technical selling as prices broke through key psychological support levels, accelerating the intraday slide as algorithmic trading flows responded to the breach of major moving averages.
From a fundamental standpoint, the latest inventory data from the U.S. Energy Information Administration (EIA) has failed to provide a sufficient floor for prices. While headline crude inventories showed a draw, the market focused on lackluster refined product demand during the height of the summer driving season. This suggests that the anticipated tightening of the physical market is not materializing at the pace previously expected. Furthermore, market participants are increasingly concerned that OPEC+ may proceed with plans to gradually phase out voluntary production cuts later this year, which would introduce additional barrels into an already softening market.
The strength of the U.S. dollar has also provided a meaningful headwind for the energy complex. A more robust dollar makes oil more expensive for international buyers, naturally dampening global demand expectations. With shifting expectations regarding the Federal Reserve's interest rate trajectory, the resulting currency volatility is acting as a persistent weight on dollar-denominated commodities. Collectively, these factors reflect a transition in market sentiment from supply-side anxiety toward deep-seated concerns regarding global macroeconomic health and the long-term outlook for crude consumption.
Technical Analysis of Brent (UKOIL)
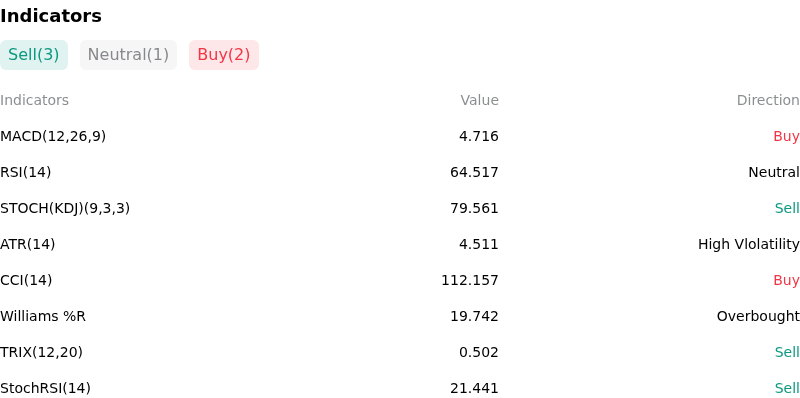
Technically, Brent (UKOIL) shows a MACD (12,26,9) value of 4.716, indicating a buy signal. The RSI at 64.517 suggests neutral condition and the Williams %R at 19.742 suggests overbought condition. Please monitor closely.
More details about Brent (UKOIL)
Recent Events and Risks:
- Chinese Demand Deterioration: Recent economic data showing a contraction in China's manufacturing activity and a significant year-on-year decline in refinery throughput has intensified fears of a structural slowdown in the world's largest crude importer.
- OPEC+ Supply Increase Concerns: Market uncertainty persists regarding the OPEC+ plan to begin unwinding voluntary production cuts of 2.2 million barrels per day starting in the fourth quarter, leading to bearish sentiment as traders anticipate an oversupplied market.
- Diminishing Geopolitical Risk Premium: Renewed diplomatic efforts toward a ceasefire in the Middle East have prompted market participants to unwind long positions, stripping away the "war premium" that previously supported prices near the $80 mark.
- Technical Support Breakdown: Brent crude's breach of key psychological and moving average support levels over the last 48 hours has triggered systematic selling and liquidation by trend-following Commodity Trading Advisors (CTAs), accelerating intraday downside momentum.
Recommended Articles


