


NZD/USD (NZDUSD) Surges on Jul 20: What Are the Key Reasons?
NZD/USD (NZDUSD) is up 0.51% at Jul 20 21:45(ET), now at $0.58649, with a 7-day up of 0.94%.
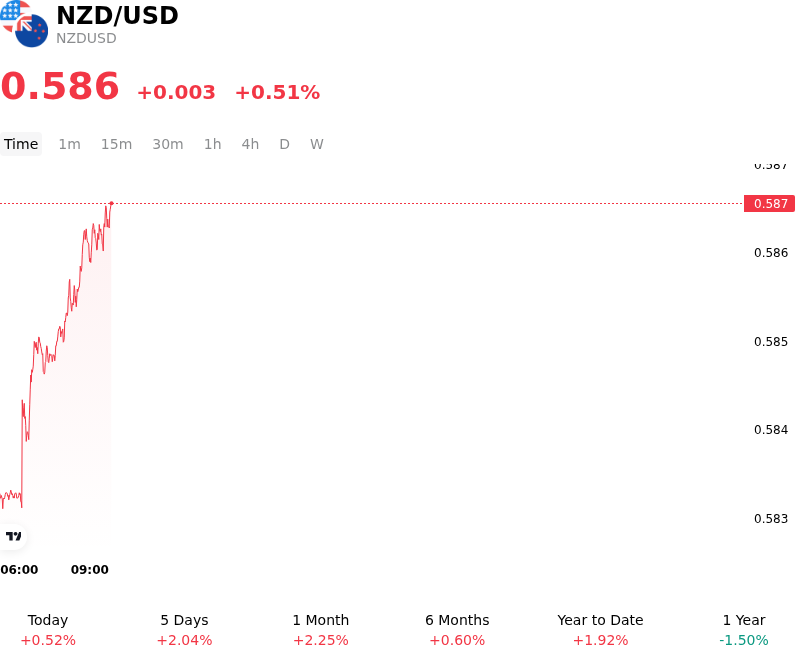
What is driving NZD/USD (NZDUSD)’s stock price up today?
The appreciation of the New Zealand dollar against the U.S. dollar was primarily driven by a hawkish repricing of the Reserve Bank of New Zealand's policy trajectory relative to a softening outlook for the Federal Reserve. Market participants reacted to recent domestic inflationary pressures that suggest the RBNZ may need to maintain a restrictive stance for longer than previously anticipated. This divergence in expected policy paths has widened the interest rate differential in favor of the kiwi, attracting yield-seeking capital flows and supporting the currency’s intraday performance.
Simultaneously, the U.S. dollar faced downward pressure following a series of softer-than-expected macroeconomic data points that reinforced the narrative of a cooling U.S. economy. Weakness in recent manufacturing and labor market indicators has led investors to increase bets on more aggressive rate cuts from the Federal Reserve in the second half of the year. As U.S. Treasury yields retreated across the curve, the greenback lost its yield advantage, providing a supportive backdrop for high-beta currencies like the New Zealand dollar.
Global risk sentiment also played a significant role in the pair's movement. A rally in international equity markets and signs of stabilizing growth in China, New Zealand's largest trading partner, bolstered demand for commodity-linked currencies. The improvement in risk appetite encouraged a rotation out of safe-haven assets like the U.S. dollar and into pro-cyclical currencies. Furthermore, a recovery in global dairy prices provided an additional fundamental tailwind for the New Zealand dollar, reflecting improved terms of trade for the export-oriented economy.
From a positioning perspective, the break above key technical resistance levels triggered a wave of short-covering by institutional investors, accelerating the upward momentum. While the move reflects a significant shift in immediate sentiment, investors remain focused on upcoming central bank communications to determine if this outperformance is supported by a broader macro trend. Key risks to the outlook include any unexpected hawkishness from Fed officials or a potential slowdown in global trade that could temper the current enthusiasm for risk-sensitive assets.
Technical Analysis of NZD/USD (NZDUSD)
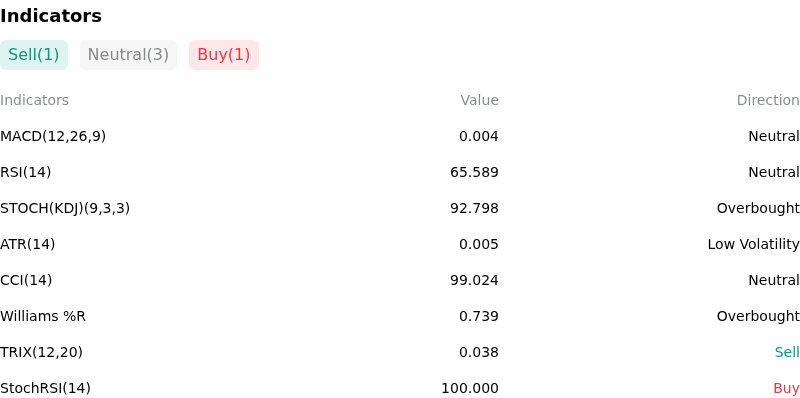
Technically, NZD/USD (NZDUSD) shows a MACD (12,26,9) value of 0.004, indicating a neutral signal. The RSI at 65.589 suggests neutral condition and the Williams %R at 0.739 suggests overbought condition. Please monitor closely.
More details about NZD/USD (NZDUSD)
Recent Events and Risks:
- RBNZ Dovish Policy Shift: Markets have significantly increased bets on an accelerated easing cycle by the Reserve Bank of New Zealand following recent data suggesting a faster-than-expected decline in domestic inflationary pressures, which has narrowed the yield advantage over the US Dollar.
- Fragile Chinese Economic Recovery: Disappointing industrial and property sector data from China within the last 48 hours has dampened the outlook for New Zealand’s primary commodity exports, triggering a sell-off in the Kiwi as a liquid proxy for Chinese growth risks.
- US Dollar Strength and Fed Repricing: Resilient US economic indicators and hawkish commentary from Federal Reserve officials have led traders to scale back expectations for immediate US rate cuts, sustaining upward pressure on the DXY and weighing on high-beta pairs like NZDUSD.
- Heightened Risk Aversion: Renewed geopolitical tensions and volatility in global equity markets have sparked a flight-to-safety, favoring the greenback while penalizing risk-sensitive currencies like the New Zealand Dollar during periods of intraday liquidity stress.
Recommended Articles


