


Lam Research Corp Stock (LRCX) Moved Down by 3.59% on Jul 16: Drivers Behind the Movement
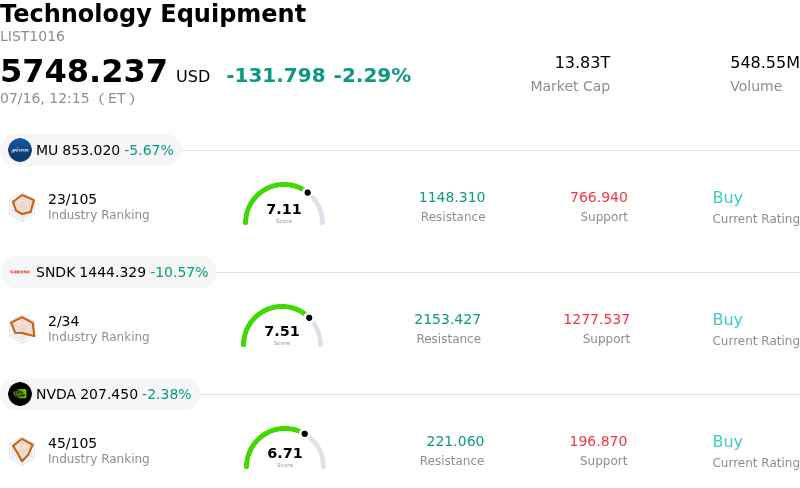
Lam Research Corp (LRCX) moved down by 3.59%. The Technology Equipment sector is down by 2.29%. The company underperformed the industry. Top 3 stocks by turnover in the sector: Micron Technology Inc (MU) down 5.55%; SanDisk Corporation (SNDK) down 10.39%; NVIDIA Corp (NVDA) down 2.38%.
What is driving Lam Research Corp (LRCX)’s stock price down today?
The recent downward pressure on semiconductor equipment manufacturers is largely driven by intensifying geopolitical tensions and the prospect of more stringent export controls. As a primary provider of essential etch and deposition tools, the company is highly sensitive to shifts in international trade policy. Investors are reacting to reports suggesting that further restrictions on high-end chipmaking machinery could impact order books in key manufacturing hubs. This regulatory uncertainty creates a challenging environment for long-term forecasting, leading institutional players to reduce their exposure to the wafer fab equipment sector.
Simultaneously, the broader semiconductor industry is facing concerns over the sustainability of capital expenditure in the memory and logic segments. While the demand for artificial intelligence infrastructure has provided a significant tailwind over the past several quarters, there is a growing narrative in the market that a period of inventory digestion or spending normalization may be approaching. Because the company has significant exposure to the NAND and DRAM markets, any signal of a slowdown in capacity expansion by major memory producers tends to trigger a reassessment of the stock growth trajectory.
Broader macroeconomic factors are also contributing to the heightened volatility. Recent updates in inflation data and signals from the Federal Reserve regarding the path of interest rates have put growth-oriented technology stocks under scrutiny. Higher interest rates typically lead to a compression of valuation multiples for companies with high price-to-earnings ratios. This macro-driven rotation away from high-beta technology names is exacerbated when industry peers provide cautious guidance, causing a ripple effect across the entire equipment ecosystem.
Analysts have also begun to adjust their near-term projections, citing potential headwinds in global equipment spending. When influential research firms lower their ratings or price targets based on perceived cyclical peaks, it often prompts a wave of profit-taking among retail and institutional investors alike. The combination of a cooling technical outlook and fundamental concerns regarding the timing of the next hardware upgrade cycle has led to a cautious stance, resulting in the current retreat as the market searches for a new support level.
Technical Analysis of Lam Research Corp (LRCX)
Technically, Lam Research Corp (LRCX) shows a MACD (12,26,9) value of -15.287, indicating a neutral signal. The RSI at 46.440 suggests neutral condition and the Williams %R at 82.193 suggests oversold condition. Please monitor closely.
Media Coverage of Lam Research Corp (LRCX)
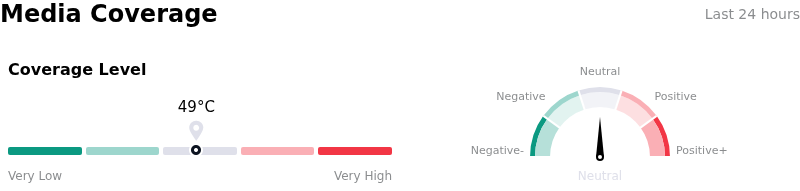
In terms of media coverage, Lam Research Corp (LRCX) shows a coverage score of 49, indicating a moderate level of media attention. The overall market sentiment index is currently in neutral zone.
Fundamental Analysis of Lam Research Corp (LRCX)
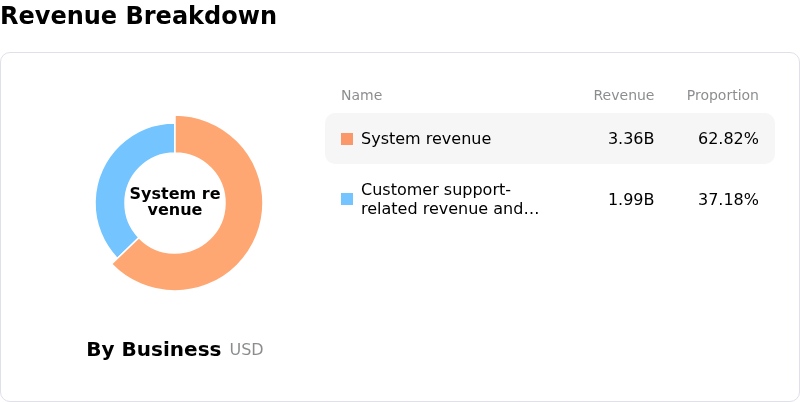
Lam Research Corp (LRCX) is in the Technology Equipment industry. Its latest annual revenue is $18.44B, ranking 12 in the industry. The net profit is $5.36B, ranking 8 in the industry. Company Profile
Over the past month, multiple analysts have rated the company as Buy, with an average price target of $361.85, a high of $480.00, and a low of $213.00.
More details about Lam Research Corp (LRCX)
Company Specific Risks:
- Geopolitical Trade Vulnerability: Lam Research maintains significant revenue exposure to the Chinese market, accounting for approximately 37% of total sales in the most recent quarter; any further escalation in U.S. Department of Commerce export restrictions on advanced semiconductor manufacturing equipment poses a direct threat to the company’s long-term revenue base.
- Memory Market Concentration: The company’s heavy reliance on the NAND and DRAM sectors makes its financial performance highly sensitive to cyclical capital expenditure shifts by memory manufacturers, where recovery remains uneven and susceptible to oversupply concerns despite the growth in High Bandwidth Memory (HBM).
- WFE Spending Volatility: Recent industry-wide signals regarding cautious Wafer Fab Equipment (WFE) spending for non-AI applications have led to analyst concerns that Lam Research may face order pushouts or delayed shipments as logic and foundry customers prioritize existing capacity optimization over new equipment purchases.
- Operating Margin Compression: Increasing research and development requirements for next-generation transition technologies, such as Gate-All-Around (GAA) and advanced packaging, are driving higher operational costs that could compress margins if top-line growth in the service and spare parts segments fails to offset equipment sales fluctuations.
Recommended Articles


