


Solana (SOLUSD) Suddenly Goes down 3.04% on Jul 8: What You Need to Watch
Solana (SOLUSD) is down 3.04% at Jul 8 00:00(ET), now at $77.73, with a 7-day up of 1.71%.
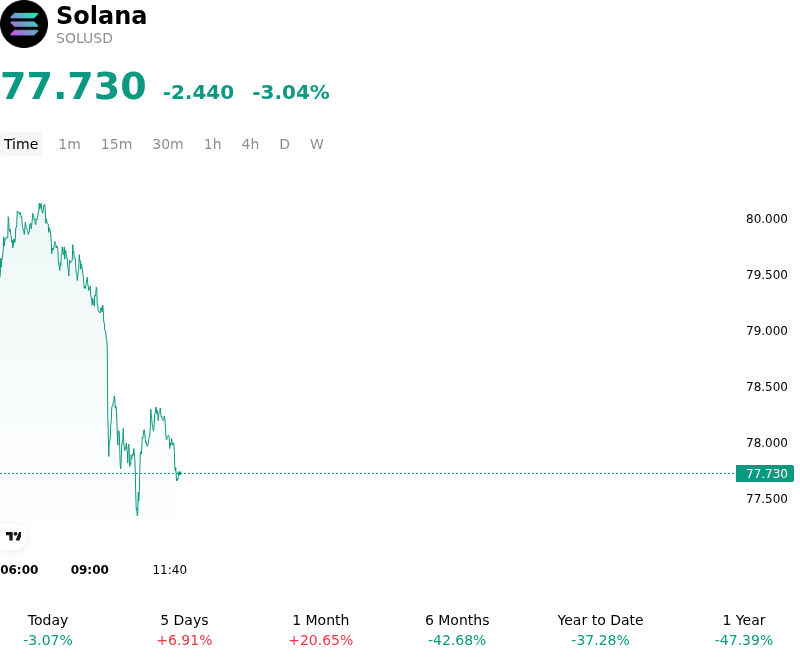
What is driving Solana (SOLUSD)’s stock price down today?
The downward movement in the SOLUSD pair reflects localized profit-taking, a flush of overleveraged long positions, and localized sell-side pressure following a rapid multi-day relief rally. While the broader digital asset market has attempted to stabilize on the back of constructive macroeconomic cues, Solana encountered intense technical friction as it pushed into a key resistance zone.
The primary driver of the intraday decline stems from derivatives positioning and structural leverage. Following Solana's recent recovery back toward major psychological price levels, long positions on major derivative platforms became highly crowded. When the spot price failed to clear the upper boundary of its horizontal resistance band, short-term momentum traders began taking profits. This initial selling pressure triggered a cascade of liquidations among overleveraged long positions clustered tightly near the local breakdown level, amplifying the downward momentum in a highly concentrated derivatives environment.
Further compounding the immediate sell-side pressure were on-chain transfers of SOL. Blockchain monitors observed large-scale holders shifting significant amounts of tokens onto centralized exchanges, signaling immediate intent to de-risk and lock in profits following the token's weekly outperformance. This localized increase in active exchange-side liquidity temporarily overwhelmed buying interest, as overall market trading volumes experienced a slight cooling trend.
This intraday pullback represents an event-driven flush of leverage rather than a structural breakdown of the ecosystem's network health. On-chain fundamentals remain robust, characterized by record transaction throughput and expanding real-world asset issuance. Recently, the network crossed key execution milestones, including processing over one billion non-vote transactions in a single week. Furthermore, institutional demand for regulated exposure continues to show resilience, with spot Solana exchange-traded funds recording steady net inflows, contrasting with the capital outflows observed across other major crypto investment products.
While the fundamental backdrop and institutional adoption indicators remain positive, investors continue to monitor the immediate risk of further profit-taking. Near-term market direction will depend on whether spot buyers step in to defend established support zones or if further leverage flushes drag the asset toward lower demand areas.
Technical Analysis of Solana (SOLUSD)
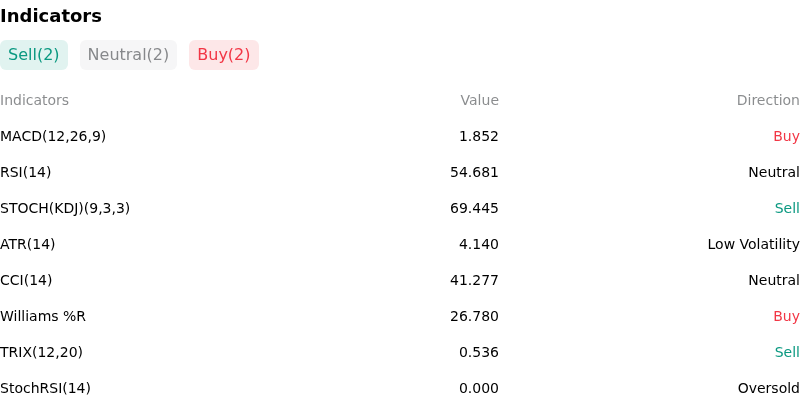
Technically, Solana (SOLUSD) shows a MACD (12,26,9) value of 1.870, indicating a buy signal. The RSI at 54.956 suggests neutral condition and the Williams %R at 26.078 suggests buy condition. Please monitor closely.
More details about Solana (SOLUSD)
Recent Events and Risks:
- Ecosystem Token Unlocks and Liquidity Siphon: A heavy July unlock schedule across fourteen Solana-based projects—highlighted by a $123.65 million token release scheduled for July 12—poses a localized liquidity-drain threat. Traders are concerned that investors adjusting portfolios ahead of these unlocks will rotate capital out of the native SOL token to absorb secondary market supply, depressing immediate spot prices.
- Concentrated Long Leverage and Downside Clusters: Derivatives market data indicates highly imbalanced and crowded retail long positioning, highlighted by recent large leveraged positions (including a newly funded 20x long wallet initiating a $18.81 million trade). This leaves the market structurally fragile, as a heavy concentration of leveraged liquidity is clustered tightly around the critical $80 support level, presenting a major risk of cascading liquidations if the price slips further.
- Whale-to-Exchange Deposits and FTX Estate Overhang: On-chain tracking has flagged elevated sell-side pressure as large-scale holders, including a transfer of approximately $31.9 million (455,784 SOL) by corporate treasury holder Forward Industries to Coinbase Prime, signal immediate intent to liquidate. This is compounded by the persistent, long-term threat of spot market distribution from the bankrupt FTX estate's remaining locked assets.
- Persistent Technical Resistance and Rejections: Despite robust network activity, SOL faces strong technical resistance in the $80 to $85 zone, capped by key daily moving averages and the 100-hourly simple moving average. Following fresh rejections at these levels, failure to secure a clean breakout keeps the asset vulnerable to a pullback toward support targets near $75, $70, and potentially $65 in a broader risk-off environment.
Recommended Articles


