


Natural Gas - Futures (NATGAS-F) Moved Sharply on Jul 6: Inventories, the Dollar, or Geopolitics?
Natural Gas - Futures (NATGAS-F) is down 2.01% at Jul 6 00:10(ET), now at $3.172, with a 7-day up of 0.25%.
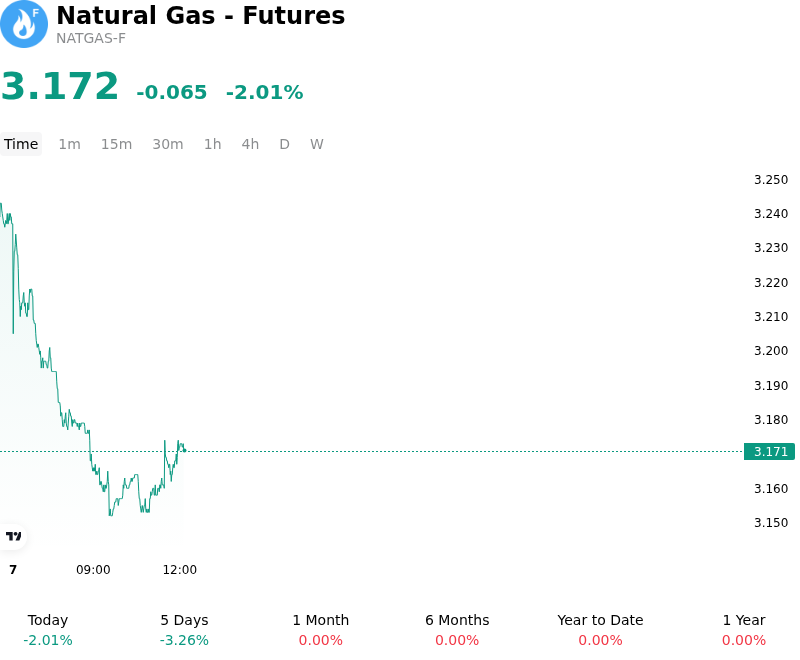
What is driving Natural Gas - Futures (NATGAS-F)’s stock price down today?
US natural gas futures faced downward pressure as the market responded to a combination of bearish domestic storage data, highly resilient supply, and shifting weather models that together offset the impact of seasonal summer heat.
The primary catalyst driving negative sentiment remains the aftermath of the U.S. Energy Information Administration's weekly inventory report. The data revealed a larger-than-expected injection of 87 billion cubic feet into underground storage, notably surpassing market expectations. This heavy build pushed total domestic stockpiles to more than six percent above the five-year historical average, reassuring market participants of comfortable supply buffers and capping immediate upside potential for prices.
This inventory build is heavily sustained by resilient domestic production. Dry natural gas output in the Lower 48 states has remained exceptionally strong, averaging near 110 to 111.7 billion cubic feet per day. High levels of associated gas production—driven by robust crude oil drilling activity in major basins like the Permian—have kept the domestic market well-supplied and reinforced the persistent storage overhang.
On the demand side, recent updates to short-term meteorological models contributed to the price decline. Weather forecasters adjusted their near-term outlooks to show cooling and moderating temperatures across the eastern two-thirds of the United States. This expected drop in cooling degree days is projected to curb electricity demand for air conditioning, stripping out the weather-driven demand premium that had previously supported prices.
Simultaneously, broader energy complex weakness, highlighted by sliding global crude oil prices, exerted a sympathetic downward drag on natural gas contracts. This combination of a looser near-term supply-demand balance and broader macroeconomic energy weakness ultimately prompted long liquidations and speculative selling by institutional investors, leading to a breakdown below key technical support levels. While long-term structural demand tailwinds from data centers and expanding export terminals continue to build, the current oversupplied spot market and softer mid-July weather outlook keep near-term pricing expectations firmly anchored.
More details about Natural Gas - Futures (NATGAS-F)
Recent Events and Risks:
- Larger-Than-Expected Storage Build: The U.S. Energy Information Administration (EIA) reported a working gas injection of 87 billion cubic feet (Bcf) for the week ending June 26, 2026, significantly surpassing the market consensus estimate of 79 to 83 Bcf. This bearish print expanded total domestic inventories to more than 6% above the five-year historical average, intensifying fears of a structural oversupply heading into the core of summer.
- Moderating Temperature Forecasts: Short-term weather models from the Commodity Weather Group have shifted cooler, predicting normal seasonal and moderating temperatures across the eastern two-thirds of the United States for July 7–16, 2026. This downward revision in expected Cooling Degree Days (CDDs) is driving down gas-fired power burn projections, stripping the weather-driven demand premium out of the prompt-month contracts.
- Resilient Domestic Production: Lower 48 dry gas production has maintained robust volumes of 110 to 111.7 Bcf per day, supported by high levels of associated gas flowing from oil-directed drilling in the Permian Basin. This relentless supply growth, compounded by the EIA upwardly revising its annual 2026 production forecast, continues to overwhelm seasonal demand spikes and cap price recovery.
- De-risking and Long Liquidation: Recent technical breakdown below key support levels—including the $3.21 threshold and the 20-day moving average—has triggered systematic long liquidations and speculative selling. This downward momentum is exacerbated by broader macro risk-off sentiment in the energy sector, which is being dampened by sliding crude oil prices and easing geopolitical risk premiums in key maritime corridors.
Recommended Articles


