


Gold hit a record near $5,600 an ounce in late January 2026, then fell below $4,000 by the end of October 2026, a drop of roughly 30% from the peak. For anyone holding or planning to buy gold, the question is whether the decline has further to run or is close to its end.
This article gives an overview of what could push gold lower in the coming weeks, what could support it and how investors might respond.
Will Gold Rate Decrease in Coming Days?
In the short term, gold remains under pressure. The metal closed October 2026 below $4,000 after two straight monthly declines, and markets were pricing a strong chance of another Fed rate hike in December 2026. Further dips are possible while that risk remains. However, several sources of demand are working against a deep, lasting fall, which is why most institutions expect prices to stabilise and recover in 2027.
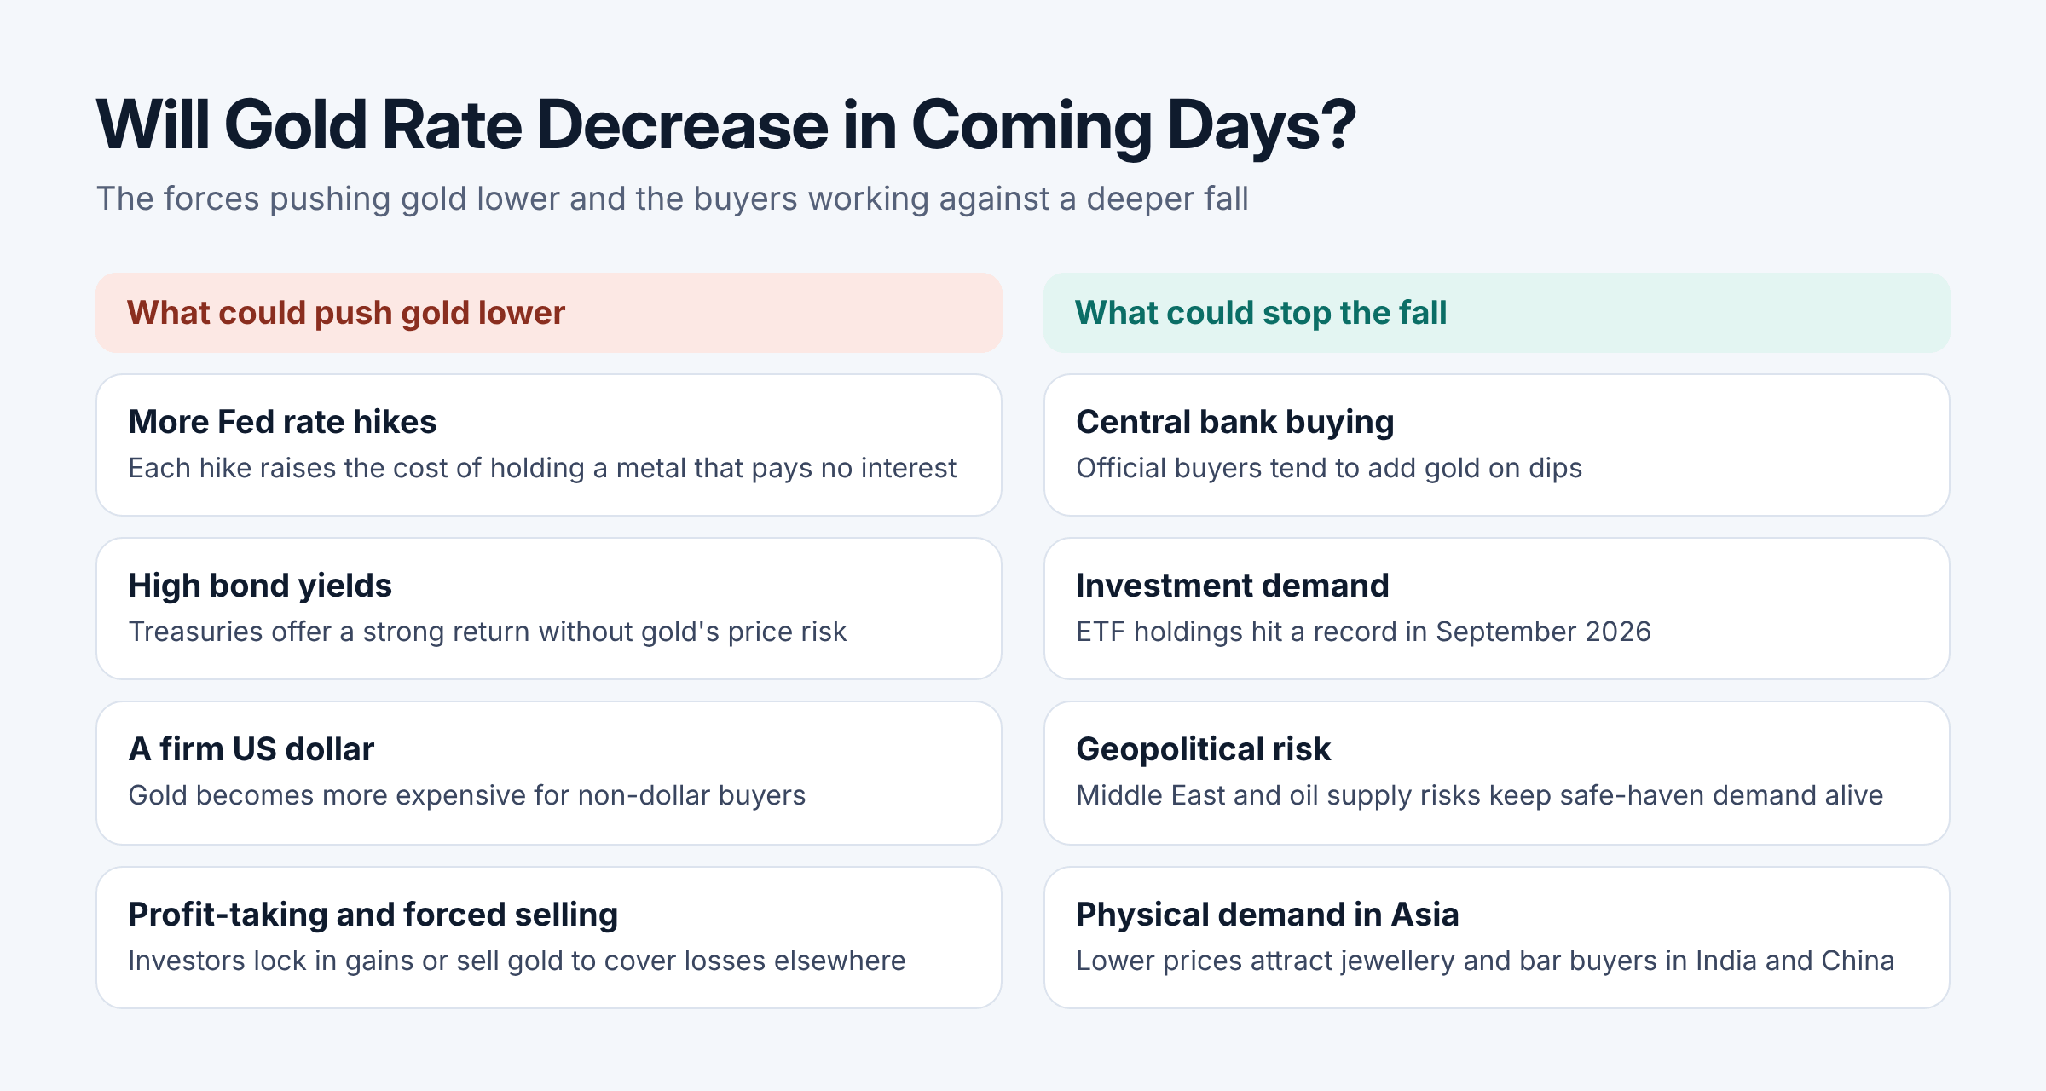
The main forces pushing gold lower and the buyers working against a deeper fall.
Factors that could cause the price of gold to fall
Gold pays no interest, so it tends to weaken when holding cash or bonds becomes more rewarding. Over the rest of 2026, these developments could push it lower:
🔻More Fed rate hikes: The Fed raised rates to 3.75% to 4.00% in September 2026 and held them in October, with two officials voting for another hike. A further hike at the December 2026 meeting, or signals of more hikes in 2027, would raise the cost of holding gold again.
🔻Hot inflation data: PCE inflation, the Fed's preferred measure, was 3.6% in September 2026, well above the 2% target. Another strong reading in the next releases would make further hikes more likely and add to the pressure on gold.
🔻Bond yields rising above 5%: The 10-year US Treasury yield fell back to about 4.9% in late October 2026 from about 5.3% at the end of September. A renewed move above 5% would give investors an even stronger return without taking on gold's price risk.
🔻A dollar rebound: Gold is priced in dollars, so a stronger dollar makes it more expensive for buyers using other currencies. If higher US rates pull more money into the dollar, demand for gold could weaken further.
🔻Profit-taking and forced selling: Investors who bought gold in 2024 or early 2025 still hold large gains, while those who bought near the January peak may want to get out closer to break-even. Both groups could sell into a recovery toward $4,200. A new stock market sell-off could also force leveraged traders to sell gold to cover losses elsewhere, as happened in October 2026.
🔻Easing geopolitical tension: Safe-haven buying linked to conflict in the Middle East has helped support gold in 2026. If tension eases and fears over oil supply fade, part of that premium could disappear and lead to more selling.
Factors that could prevent the price of gold from falling
At the same time, gold has strong buyers who are less sensitive to interest rates. These buyers, along with a few other factors, could limit how far prices fall:
🔺Strong demand: Central banks bought 289 tonnes of gold in the second quarter of 2026, the strongest second quarter on record, according to the World Gold Council. Global gold ETFs added about 67 tonnes in September 2026, taking total holdings to a record, even as prices fell. Lower prices also tend to attract jewellery and bar buyers in India and China. Together, this demand helps cushion declines.
🔺The Fed nearing the end of its hikes: Even if the Fed raises rates again in December 2026, it may be close to the end of its tightening cycle. A clear signal that rates have peaked, or talk of rate cuts in 2027, would quickly ease the pressure on gold.
🔺Safe-haven demand if growth slows: Higher rates raise the risk of a slowdown in the US economy and a longer fall in stock markets. Once any first wave of forced selling passes, investors often turn back to gold to protect their wealth.
🔺Geopolitical risk: Conflict in the Middle East and fears over oil supply keep safe-haven demand alive. Any escalation could quickly lift gold.
🔺Debt and currency concerns: Large US budget deficits and rising government debt keep some investors worried about the long-term value of the dollar. Many central banks are also reducing their reliance on dollar reserves, which supports steady demand for gold.
🔺Bargain hunting: After falling about 30% from its January peak, gold looks better value to buyers who missed the rally. Steady buying below $4,000 could slow the decline.
How Has Gold Performed in 2026?
Gold's 2026 path falls into clear phases: a record-breaking rally in January, a sharp correction through mid-year as the Fed turned hawkish, a short rebound in August, and renewed weakness into the autumn. Overall, gold was on course for its biggest annual decline since 2015 by the end of October 2026.
Price action and key volatility triggers in 2026
Gold's moves in 2026 can be split into five phases, each with a different main driver. The chart below shows the full path.
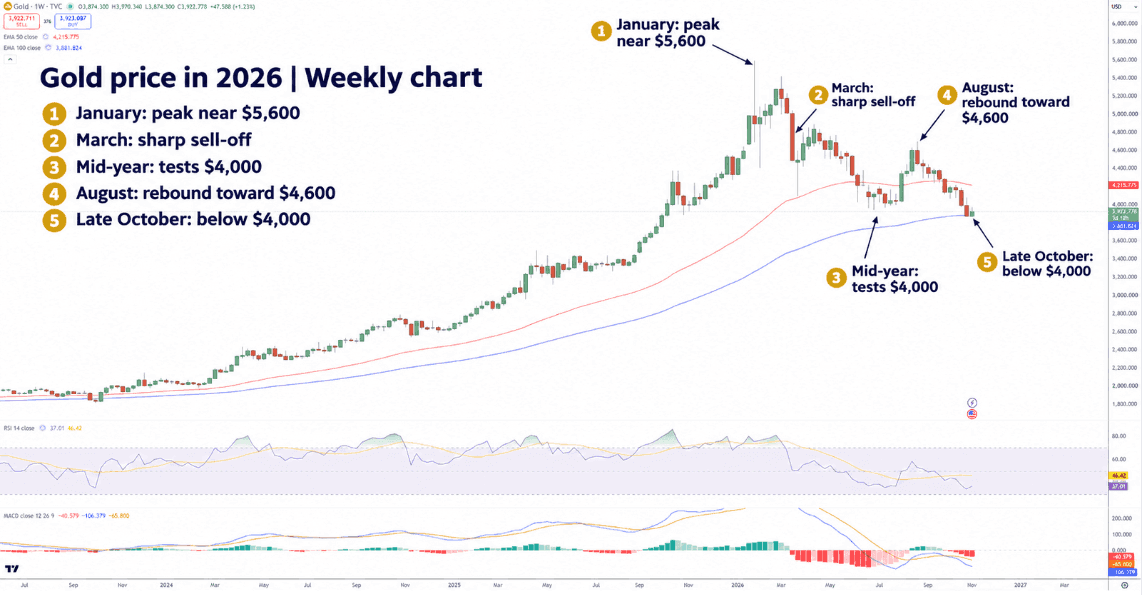
Gold price in 2026. Source: TradingView
January 2026: Gold rallied to a record near $5,600 in late January, driven by safe-haven demand, central bank buying and expectations of lower interest rates.
February to March 2026: A sharp sell-off followed, with gold down about 12% in March alone, as investors took profits after the record, yields rose and the Fed turned more hawkish.
April to June 2026: Prices kept falling to about $4,000, gold's worst quarter since 2013. Inflation came in above forecasts, rate-hike expectations grew and the dollar climbed to a one-year high.
July to August 2026: Gold stabilised, then rebounded to a three-month high in August, helped by a softer dollar and renewed buying on the dip.
September to October 2026: Gold fell again after the Fed's September rate hike and broke below $4,000 in late October, as high yields and forced selling during a stock market sell-off added to the pressure.
Market sentiment: are buyers or sellers in control?
At the end of October 2026, sellers had the upper hand. Gold posted two consecutive monthly declines, fell to its lowest level of 2026 below $3,900, and slipped below $4,000, a round-number level that had acted as support since mid-year. Speculative traders also cut their positions, with managed-money net long positions on COMEX falling by the equivalent of 84 tonnes in September 2026, according to the World Gold Council.
Buyers have not disappeared, though. ETF holdings reached a record in September 2026 and central banks continued to buy, which suggests long-term investors are using the decline to build positions. Short-term traders are less confident. As of November 3, 2026, gold traded near $3,923, and the $4,000 level it lost in October now acts as a ceiling. Until buyers can push prices back above it, rallies are likely to attract selling from investors who want to reduce their exposure.
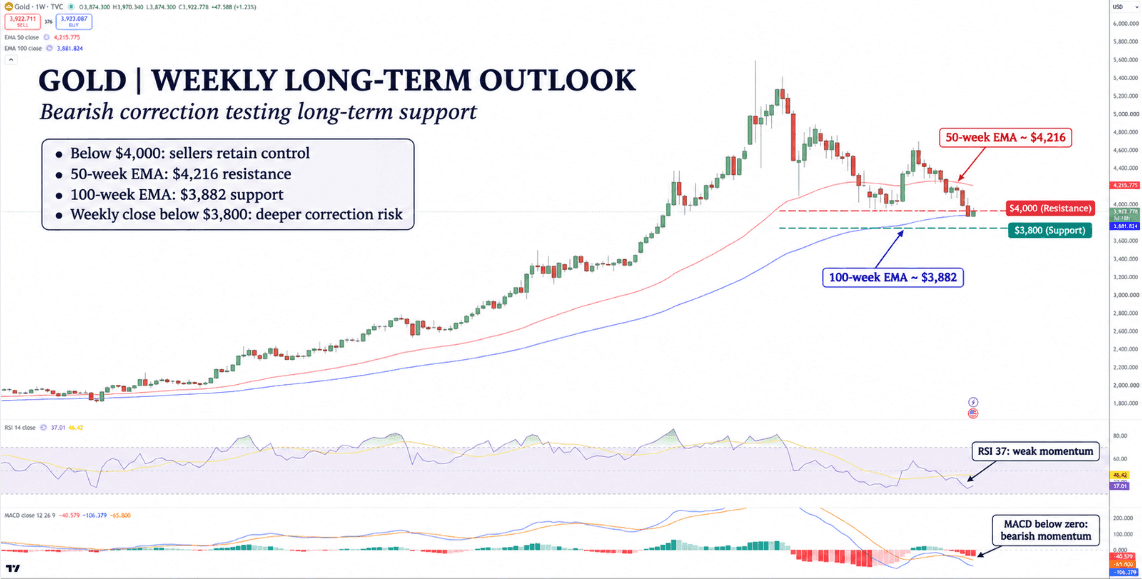
Gold weekly chart with key levels. Source: TradingView
What Are the 4 Signals That Could Cause Gold Rate Decrease?
Gold rarely falls without warning. These four signals have come before most of gold's declines in 2026, and watching them can help you judge whether gold's decline is likely to continue.
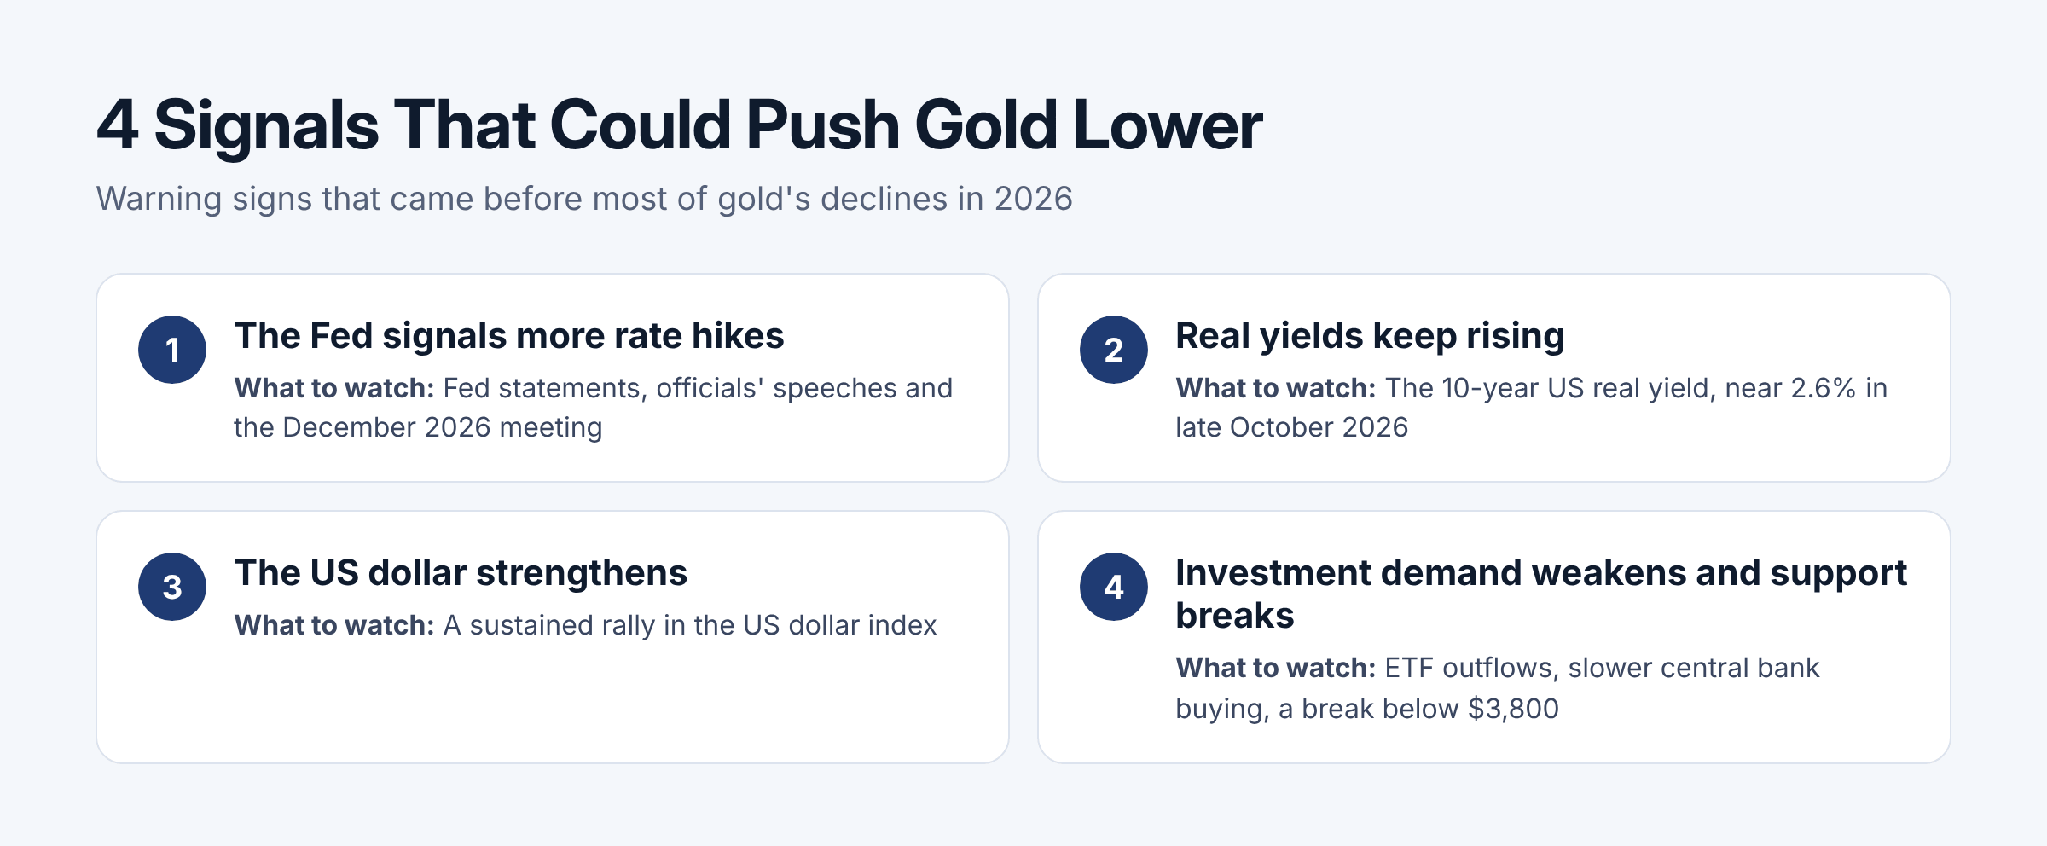
Four warning signs to watch for a further decline in gold
1 The Fed signals more rate hikes
The clearest warning sign is a Fed that keeps raising rates or signals it may do so. Higher rates make interest-bearing assets more attractive than gold. Watch Fed statements, officials' speeches and the December 2026 meeting: if hike expectations rise further, gold's recovery is likely to be delayed.
2 Real yields keep rising
Real yields, or bond yields after inflation, measure the true opportunity cost of holding gold. The 10-year US real yield stood near 2.6% in late October 2026, a high level by historical standards. If real yields climb further, gold usually struggles; if they start to fall, the pressure on gold eases.
3 The US dollar strengthens
A rising dollar index often signals tighter financial conditions and makes gold more expensive for global buyers. A strong dollar weighed on gold through much of the second quarter of 2026. Another sustained rally in the dollar would be a sign that gold could slide further.
4 Investment demand weakens and key support breaks
Gold's floor depends on continued buying from ETFs and central banks. Warning signs include ETF outflows over several weeks, slower central bank purchases in the World Gold Council's quarterly data, and a break below major support levels such as $3,800. When these appear together, they often trigger further selling from trend-following funds.
What Do Major Institutions Say About Gold Price Forecasts for 2026?
Most major banks have cut their 2026 gold forecasts since the spring, but very few have turned bearish on the longer term. Their message is broadly consistent: the near-term outlook depends on the Fed, while the long-term case for gold remains intact.
Near-term caution: Analysts polled by Reuters in October 2026 said a stronger dollar and high Treasury yields are weighing on prices. JPMorgan said in July 2026 that the risks to its forecast were skewed to the downside, mainly because the Fed could keep raising rates.
Correction largely done: Deutsche Bank said in August 2026 that most of gold's correction appeared to be over, with its models suggesting a bottom near $3,900 rather than a deeper fall. Gold closed October 2026 below that level, so the view has been tested.
Long-term support: Most institutions still expect central bank buying, concerns about currency debasement and steady demand from India and China to support gold in 2027. The World Gold Council expects investment demand to remain constructive for the rest of 2026, even though central bank buying is likely to finish below last year's record pace.
While most institutions agree on the direction, their price targets still differ. The table below lists forecasts with the date each was published, because many were cut during 2026 as the Fed turned more hawkish.
With gold trading below $4,000 in late October 2026, every forecast in the table sits above the market price. That gap shows institutions still expect a recovery, but several of these targets were set before the October 2026 decline and may be revised lower.
Gold Scenarios for 2026: When Will It Fall, Stabilize, and Rise Again?
The path for gold over the coming months depends mainly on the Fed's December 2026 decision, the dollar and whether official and investor demand holds up. The scenarios below are this article's estimates, not institutional forecasts.
Bullish case ($4,300 to $4,500): gold rises again
If the Fed holds rates in December 2026 and signals that tightening is over, the dollar and yields could ease. In that case, gold could reclaim $4,000 quickly and move back toward $4,300 to $4,500 by the end of 2026, especially if tension in the Middle East flares again. A stronger recovery toward the Reuters poll's 2027 median of about $4,650 could follow.
Base case ($3,800 to $4,200): gold stabilises
If rates stay high but stop rising, gold could trade in a range of roughly $3,800 to $4,200 for the rest of 2026. Selling pressure would fade, but buyers would wait for clearer signs of Fed relief before pushing prices higher. Central bank buying would keep the downside limited, setting up a gradual recovery in 2027.
Bearish case ($3,500 to $3,700): gold falls further
If the Fed raises rates again in December 2026 and signals more hikes, the dollar and real yields could rise further. A break below $3,800 could then trigger more fund selling and push gold toward $3,500 to $3,700. Even in this case, strong buying from central banks and Asian buyers at lower prices would likely slow the decline.
What would change the outlook?
More bullish: A clear Fed pause, falling real yields, a weaker dollar or a sharp escalation in the Middle East.
More bearish: Inflation staying high, another Fed hike, several weeks of ETF outflows or slower central bank buying.
Is It a Good Time to Buy Gold?
There is no single answer, because the right approach depends on your goals and time horizon. After a 30% correction, gold is far cheaper than at its January peak, but the trend has not yet turned up. The suggestions below match different types of investors. The reference prices are based on gold trading near $3,900 in early November 2026 and are a guide only, not a recommendation.
✅ Long-term investors: Gold's long-term support from central banks and diversification demand remains strong. Buying in stages, for example in three or four parts over several months, reduces the risk of buying everything just before another dip. With gold near $3,900, one option is to buy a first portion in the $3,800 to $4,000 range and keep some cash back in case prices slip toward $3,700.
✅ Physical gold buyers: If you are buying jewellery, bars or coins for saving, lower prices can be an opportunity. Spreading purchases over time and comparing making charges matters more than catching the exact bottom. For reference, gold near $3,900 an ounce is about 30% cheaper than at its January peak near $5,600, so small, regular purchases at these levels may suit savers.
✅ Short-term traders: Volatility creates opportunities in both directions. With contracts for difference (CFDs), such as Mitrade's gold CFDs, you can trade gold's rises and falls, but clear entry levels, stop-loss orders and small position sizes are essential. For example, a move back above $4,000 could open the way to $4,200, with a stop-loss below about $3,850. If gold breaks below $3,800 instead, sellers may target $3,700.
✅ Cautious investors: Waiting for confirmation, such as gold reclaiming $4,000 or the Fed signalling a pause, may mean a higher entry price but lower risk of buying into a falling market. A weekly close above $4,000, or better still above $4,200, would be a clearer sign that the decline is over.
✅ Portfolio investors: Gold works best as a diversifier. Deciding how much of your portfolio should be in gold, and sticking to that share, is more useful than trying to time each swing. For example, if the fall has pushed your gold holding below its target share, you could top it up on dips below $4,000 and trim it again if prices recover above $4,500.

Trade XAU/USD with Tight Spreads
How Can Mitrade's Tools Help You Manage Gold Price Fluctuations in 2026?
Volatile markets reward preparation and risk control. Mitrade offers several tools that help traders respond to gold's swings in either direction. Its UAE entity, Mitrade Financial Services LLC, is authorised and regulated by the UAE Capital Market Authority (CMA) under licence number 20200000397.
✅ Trade rising and falling prices: Gold (XAUUSD) CFDs let you go long if you expect a rebound or short if you expect further declines, without owning physical gold.
✅ Built-in risk management: Stop-loss, take-profit and trailing stop orders help you limit losses and protect gains automatically, and negative balance protection means you cannot lose more than your account balance.
✅ Low cost to start: Trading is commission-free with competitive spreads, and the minimum deposit starts from $50.
✅ Practise with virtual funds: A free demo account with $50,000 in virtual funds lets you test gold strategies before using real money.
✅ Trade anywhere: The Mitrade platform is available on web, desktop and mobile, so you can react quickly to Fed decisions or data releases.
You might be interested in the following article >>> Best 6 Gold Trading Platforms in the UAE for 2026: A Comprehensive Comparison of Gold Costs


Will gold prices go down in 2026?
Gold has already fallen sharply in 2026, from a record near $5,600 in January to below $4,000 in late October 2026. Further short-term declines are possible if the Fed raises rates again in December 2026, but most institutions expect prices to stabilise and recover in 2027, supported by central bank and investment demand.
What is the best day of the week to buy gold?
There is no reliable best day. Gold trades almost around the clock from Monday to Friday, and its price reacts mainly to economic data and central bank decisions rather than to the day of the week. Prices often move most around major US releases such as the monthly jobs report, inflation data and Fed meetings. For most buyers, spreading purchases over time matters more than choosing a particular day.
How much will the gold price fall during a market correction?
It varies widely. Within a long-term uptrend, gold has often pulled back by 5% to 15% before recovering. Deeper corrections are less common but do happen: gold fell about 45% between 2011 and 2015, and about 20% between 2020 and 2022. The 2026 correction reached roughly 30% from the January peak by the end of October 2026, which is already larger than a typical pullback.
* The content presented above, whether from a third party or not, is considered as general advice only. This article should not be construed as containing investment advice, investment recommendations, an offer of or solicitation for any transactions in financial instruments.


