
Avalanche Price Forecast: AVAX hits an OI record high of nearly $800 million
- Avalanche price extends its gains on Tuesday after rallying more than 18% in the previous week.
- Derivatives and on-chain data support the bullish thesis, as Open Interest reaches a record level and TVL also rises.
- The technical outlook suggests rally continuation with bulls targeting levels above $30.
Avalanche (AVAX) price trades in green above $25 at the time of writing on Tuesday after gaining over 18% in the previous week. Derivatives and on-chain data support the bullish thesis as AVAX’s Open Interest (OI) reached a record level and Total Value Locked continues to climb. The technical outlook suggests an upward trend, with bulls targeting a breakout above the $30 level.
Avalanche’s derivatives and on-chain data show bullish bias
Futures’ OI in Avalanche at exchanges rose from $667.08 million on Saturday to $796.35 million on Tuesday, a new all-time high, according to data from CoinGlass. An increasing OI represents new or additional money entering the market and new buying, which could fuel the current AVAX price rally.

Avalanche Open Interest chart. Source: CoinGlass
Data from crypto intelligence tracker DefiLlama shows that AVAX’s TVL has been constantly rising, from $1.49 billion on July 1 to $1.93 billion on Tuesday, reaching levels not seen since September 2022. This increase in TVL indicates growing activity and interest within Avalanche’s ecosystem, suggesting that more users are depositing or utilizing assets within AVAX-based protocols.

Avalanche TVL chart. Source: DefiLlama
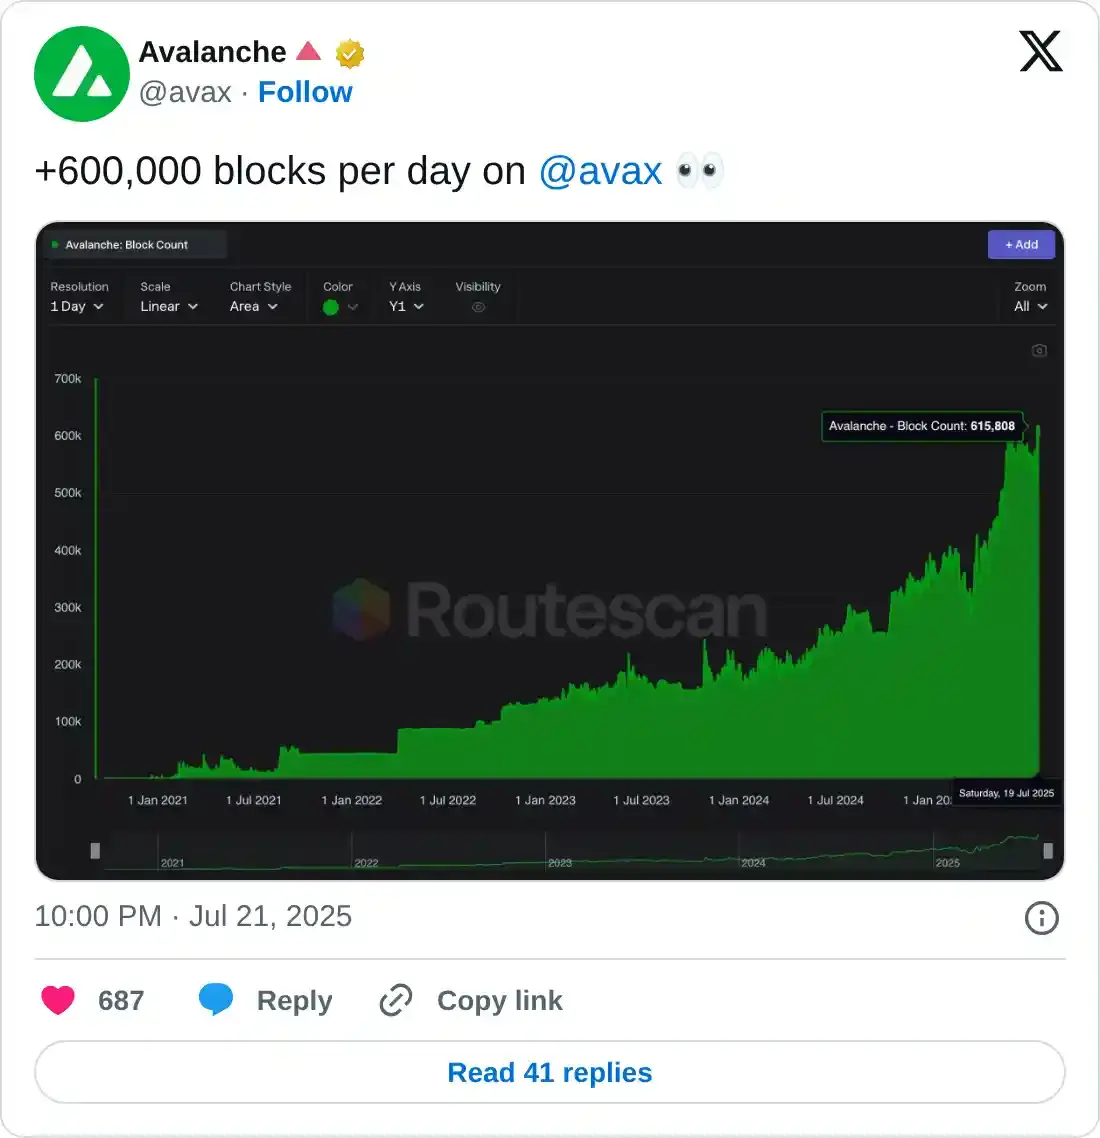
Another aspect bolstering the platform’s bullish outlook is a recent surge in traders’ interest and liquidity in Avalanche’s chain. Avalanche X post on Monday highlights a significant increase to 600,000 blocks processed daily, reflecting a sharp rise in network activity since 2021.
Avalanche Price Forecast: AVAX bulls aiming for levels above $30
Avalanche price broke and closed above the 200-day Exponential Moving Average (EMA) at $23.34 on Thursday, found support around this level the next day and rallied 7.44% until Monday. At the time of writing on Tuesday, it trades at around $25.73.
If AVAX continues its upward trend and closes above the daily resistance at $26.43, it could extend the rally toward its 50% Fibonacci retracement level at $30.11 (drawn from January high of $45.27 to the April low of $14.96). A successful close above this level could extend additional gains toward the 61.8% Fibonacci retracement level at $33.69.
The Relative Strength Index RSI on the daily chart reads 78, which is above its overbought level of 70, indicating strong bullish momentum. Meanwhile, the Moving Average Convergence Divergence (MACD) indicator showed a bullish crossover in early July, which remains in effect. The rising green histogram bars above its neutral zero line suggest that bullish momentum is gaining traction.
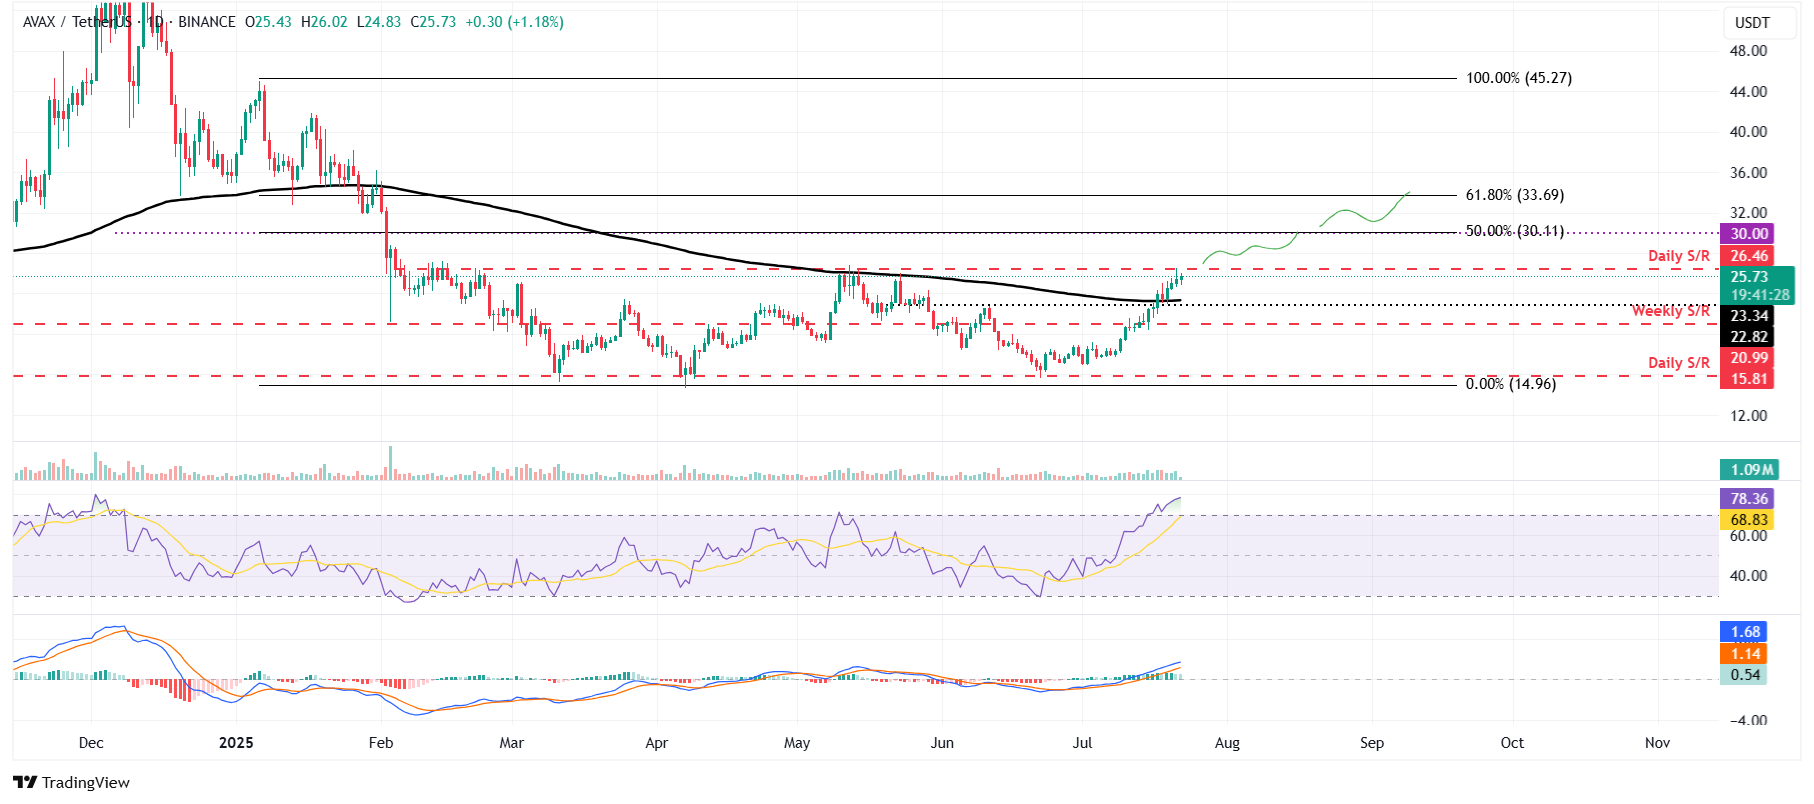
AVAX/USDT daily chart
However, if AVAX faces a pullback, it could extend the decline to find support around its 200-day EMA at $23.34.
บทความแนะนำ


