


Bitcoin and Gold Outlook: BTC slides as ETF outflows weigh, XAU gives back recent gains
- Bitcoin corrects below $83,000 as sell-side pressure persists amid $681 million in ETF outflows last week.
- Gold holds a broader trend correction below $4,200 as a cluster of declining moving averages signals a weaker recovery outlook.
- Market participants shift their focus to the US CPI report and the Fed’s October monetary decision.
Cryptocurrency prices are broadly pulling back on Monday, with Bitcoin (BTC) trading lower, below $83,000. Last week’s correction pushed BTC toward $80,000, but bulls reengaged and increased risk exposure, lifting prices near $84,000. Persistent resistance at the $87,000-$88,000 supply zone has triggered buyer fatigue, with profit-taking and ongoing macroeconomic uncertainty contributing to the current corrective move.
“October has a reputation as a strong month for crypto, last year being the notable exception, and options pricing suggests the market may be positioning for a return to form,” QCP Market Colour analysis said, adding, “spot hasn’t quite got the memo: BTC keeps failing to clear $87,000, yet it has held its range, with support around $80,000 keeping things intact.”
Gold (XAU/USD), meanwhile, remains in a broader downtrend, trading below $4,200 at the time of writing. Looking back, the metal topped out at $4,697 in August but has since lost momentum, reflecting growing investor concerns about at least one rate hike before year-end, a stronger US Dollar (US), profit-taking, and sticky geopolitical tensions in the Middle East.
Uncertainty grips markets ahead of US CPI
The United States (US) Bureau of Labor Statistics (BLS) is expected to release September’s Consumer Price Index (CPI) report on Wednesday. This critical inflation gauge measures changes in the prices of goods and services. The Federal Reserve (Fed) uses the CPI report and other economic indicators to set monetary policy, aiming to bring inflation down to its long-term 2% target.
Economists broadly expect stronger headline inflation driven by higher Oil and energy prices linked to ongoing geopolitical pressures, according to Bloomberg. Moreover, market participants are pricing in nearly 81% odds that the Federal Open Market Committee (FOMC) will leave interest rates unchanged in October. However, economists still see a higher probability of at least one more rate hike before year-end.
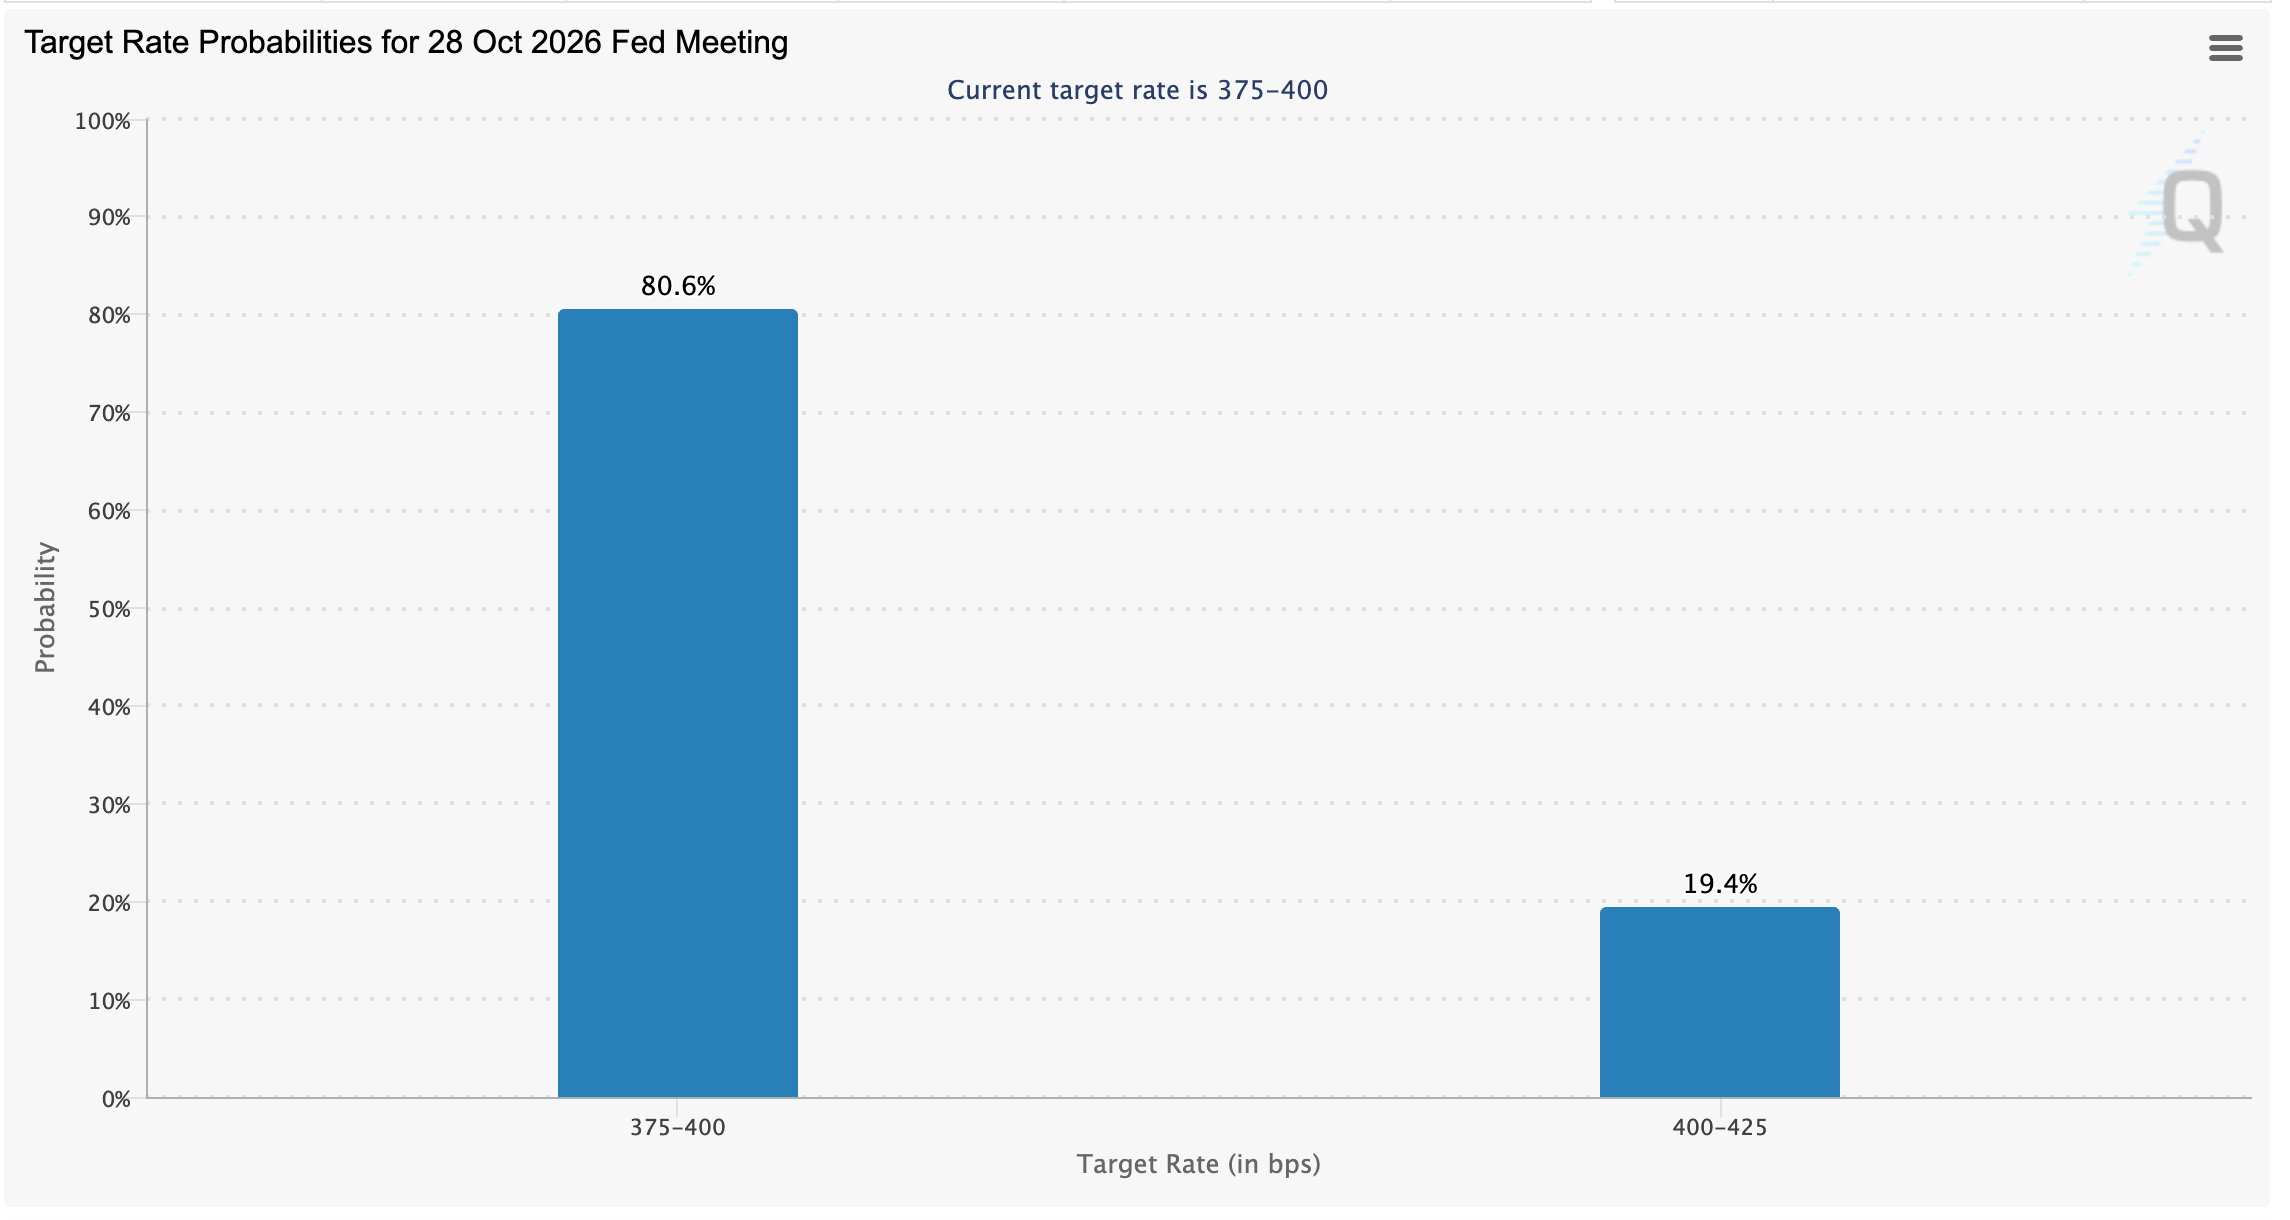
“The next catalyst could arrive on Wednesday with CPI. An upside surprise could lift expectations for an October hike, while an in-line or softer print would reinforce the case for the Fed to stay on hold,” QCP analysts added, “Thursday’s PPI adds a further read on inflation, ahead of Warsh’s Friday speech at the IMF-World Bank Annual Meetings, where any echo of his hawkish Jackson Hole messaging could weigh on risk sentiment.”
Bitcoin ETF outflows return
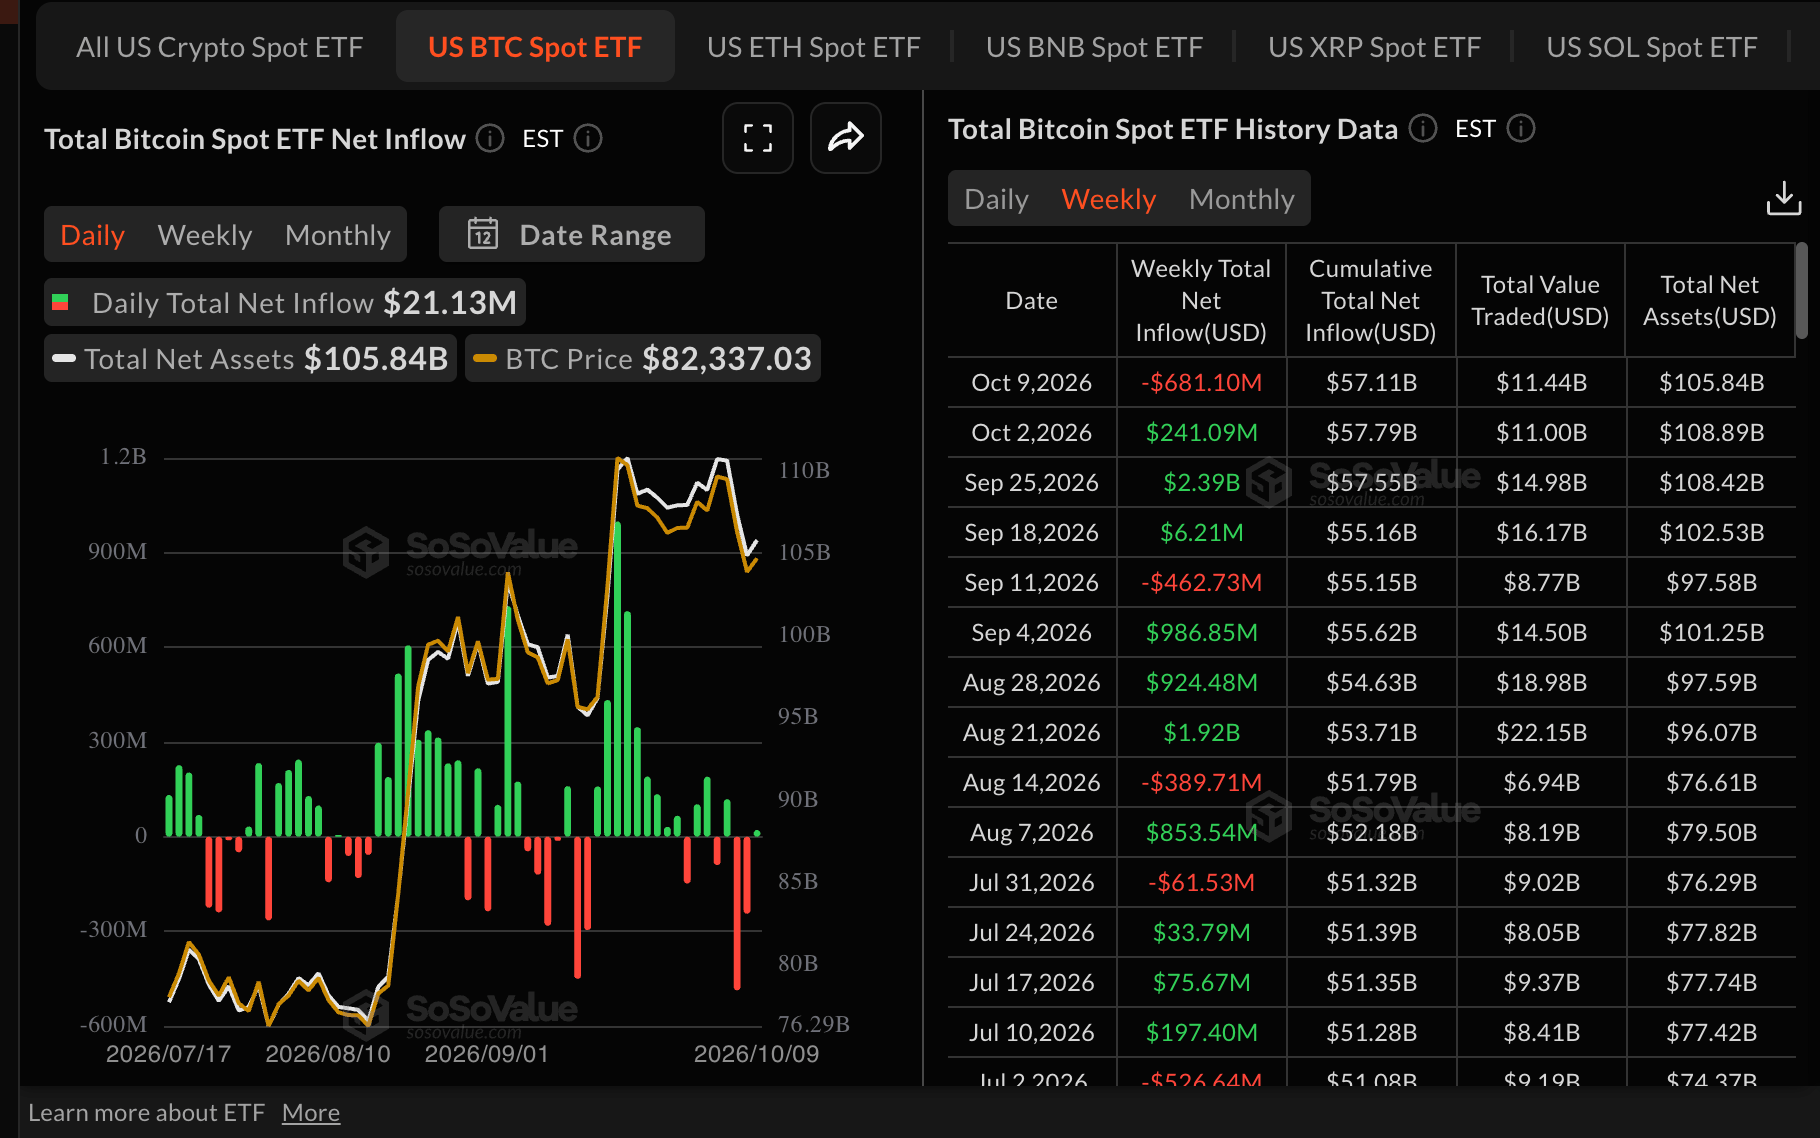
Major digital assets, including Bitcoin and Ethereum (ETH), saw persistent outflows from spot Exchange-Traded Funds (ETFs) last week, underscoring investor concerns about macroeconomic uncertainty, sticky geopolitical tensions, and growing sell-side pressure largely driven by profit-taking and buyer exhaustion.
Bitcoin spot ETFs recorded $681 million in outflows last week, as cumulative inflows cooled to $57 billion. Total assets under management average $106 billion, according to SoSoValue.
Technical analysis: Bitcoin corrects as sell-side pressure persists
Bitcoin trades at $82,967 as headwinds weigh on price action. Despite the pullback from an intraday high of $84,110, the largest crypto by market capitalization holds a constructive bullish structure, with price remaining well above its key Exponential Moving Averages (EMAs) and the prevailing SuperTrend support.
The 50-day EMA near $80,167 sits just under spot and, together with the SuperTrend line around $79,663, underpins the uptrend structure, while the 100-day and 200-day EMAs down at $76,391 and $75,494, respectively, reinforce a broader positive backdrop.
Momentum is more mixed, with the Relative Strength Index (RSI) easing back toward the mid-50s and the Moving Average Convergence Divergence (MACD) slipping slightly negative again, which hints at waning upside pressure rather than a confirmed top.
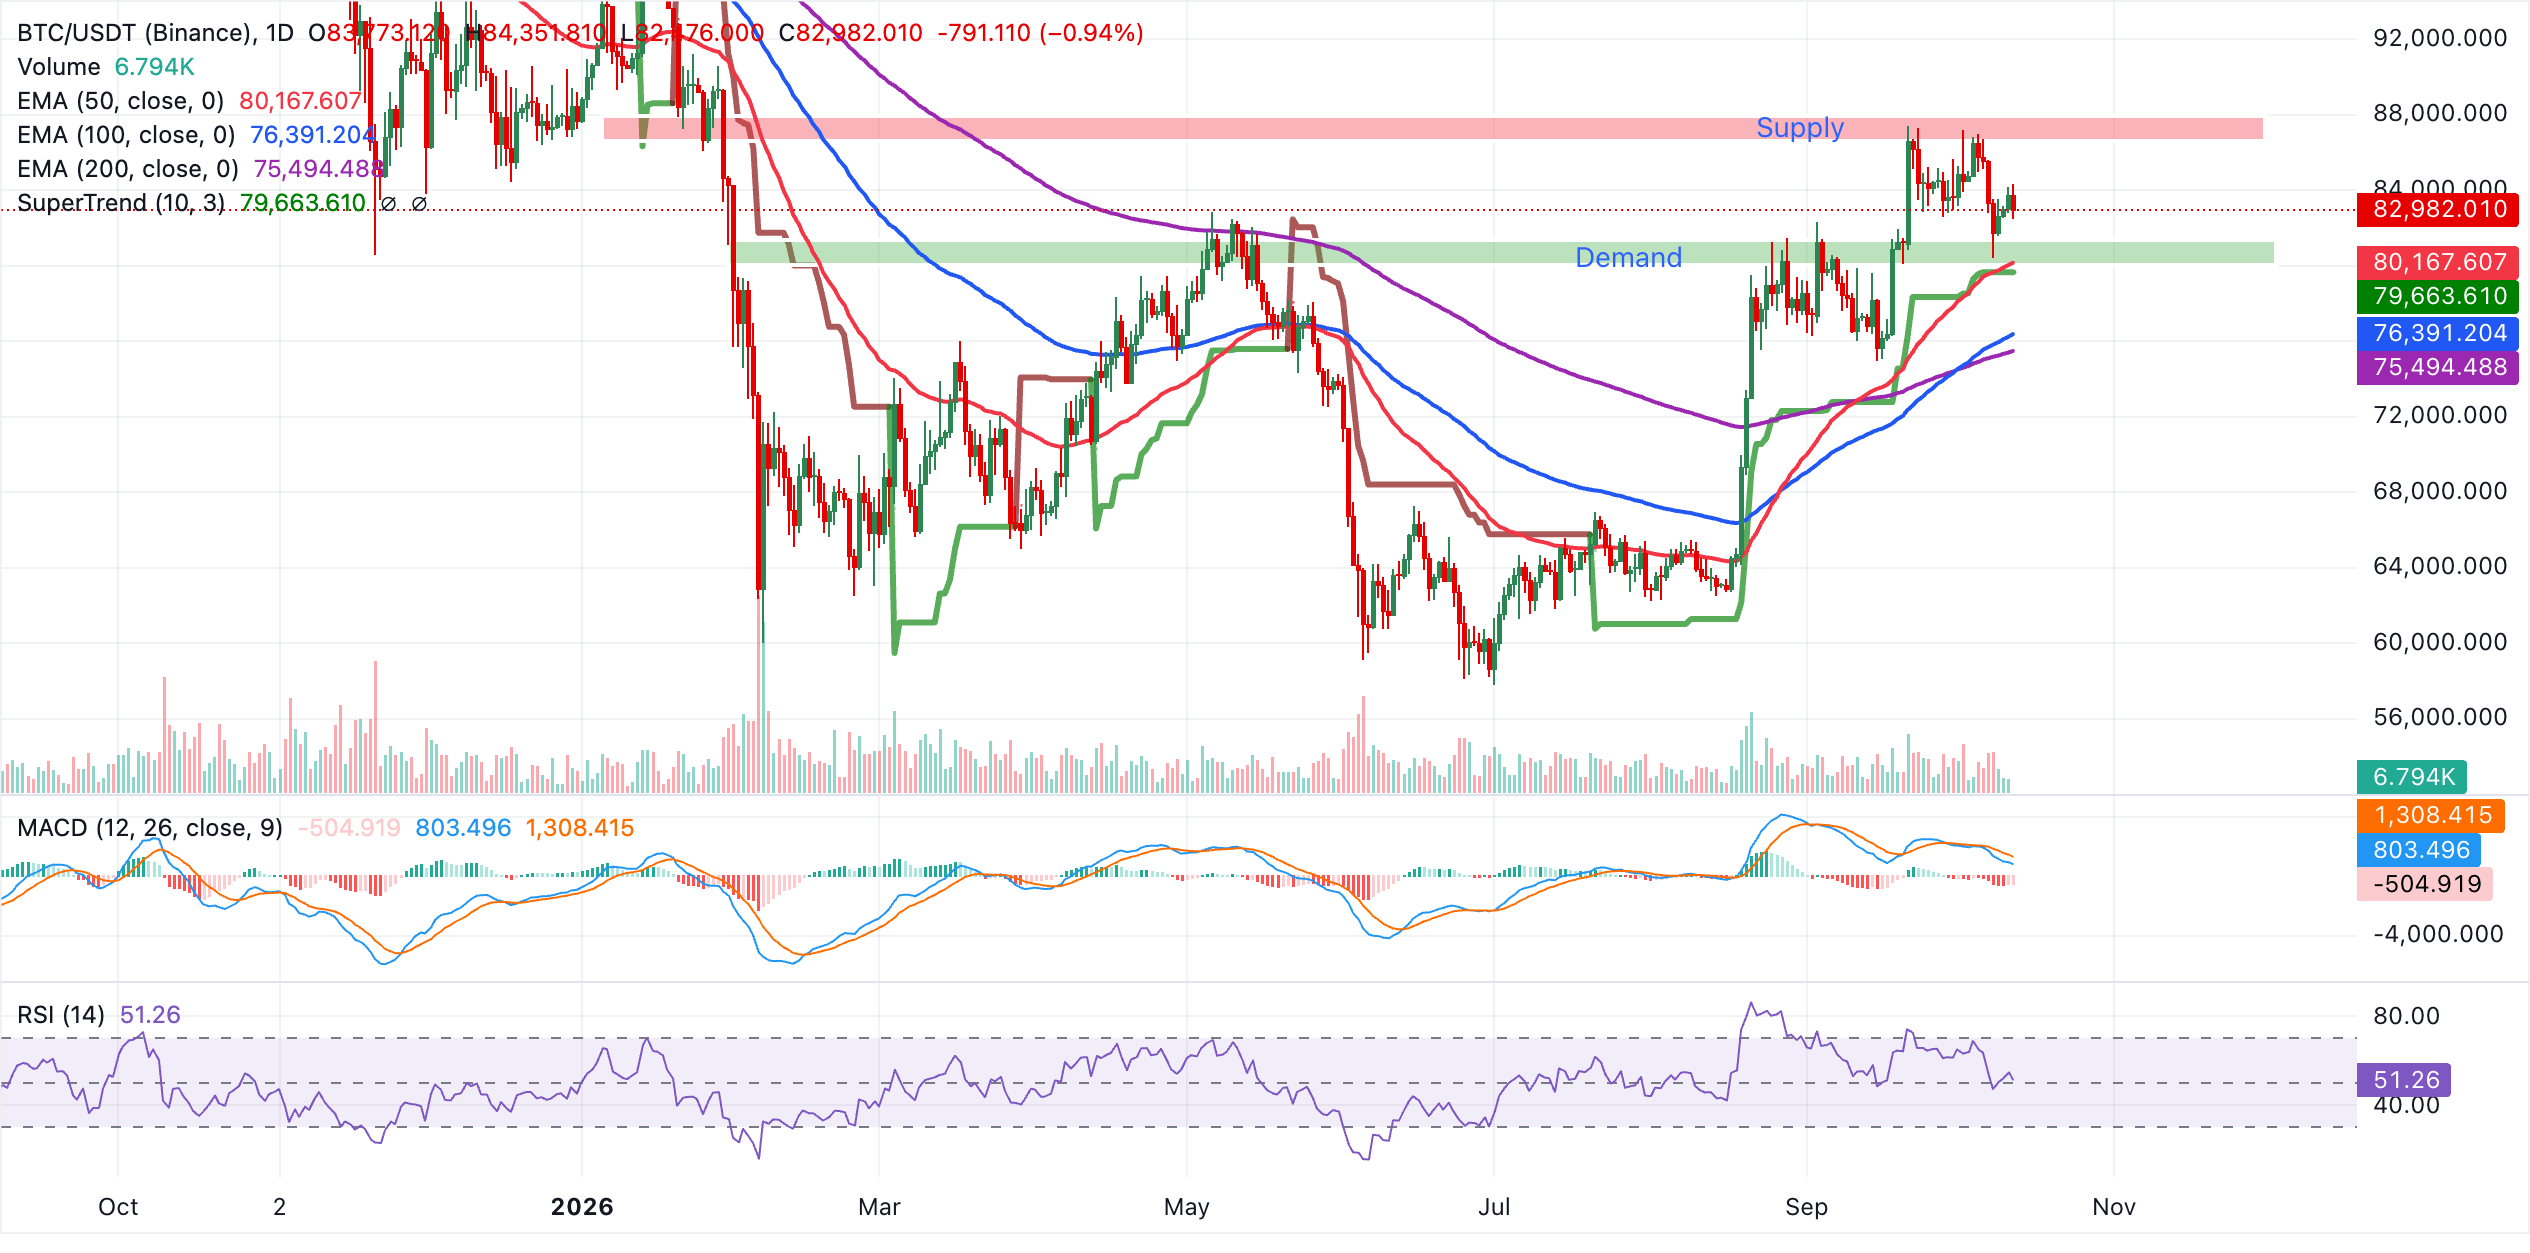
Immediate support lies at the 50-day EMA around $80,167, with the SuperTrend line at $79,663 forming the next cushion if sellers push a deeper pullback. Below there, the 100-day EMA at $76,391 and the 200-day EMA at $75,494 mark more substantial demand zones that would be expected to attract dip-buying interest while the broader uptrend stays intact. A decisive break beneath this cluster would be needed to meaningfully undermine the current bullish technical outlook.
Gold technical analysis: XAU sellers retain control
XAU trades at $4,175, keeping a bearish tone as it remains capped beneath a dense band of moving-average and trendline resistance. Price is marginally below the broken downward resistance trendline at $4,176, while the 50-day EMA at $4,272, the 200-day EMA at $4,303, and the 100-day EMA at $4,317 all sit overhead, suggesting rallies are likely to be sold.
The Parabolic SAR at $4,263 is also above spot, reinforcing the topside cap. At the same time, the RSI near 44 leans slightly bearish but is not oversold, and the MACD histogram has been narrowing toward zero, hinting at fading downside momentum rather than a clear reversal.
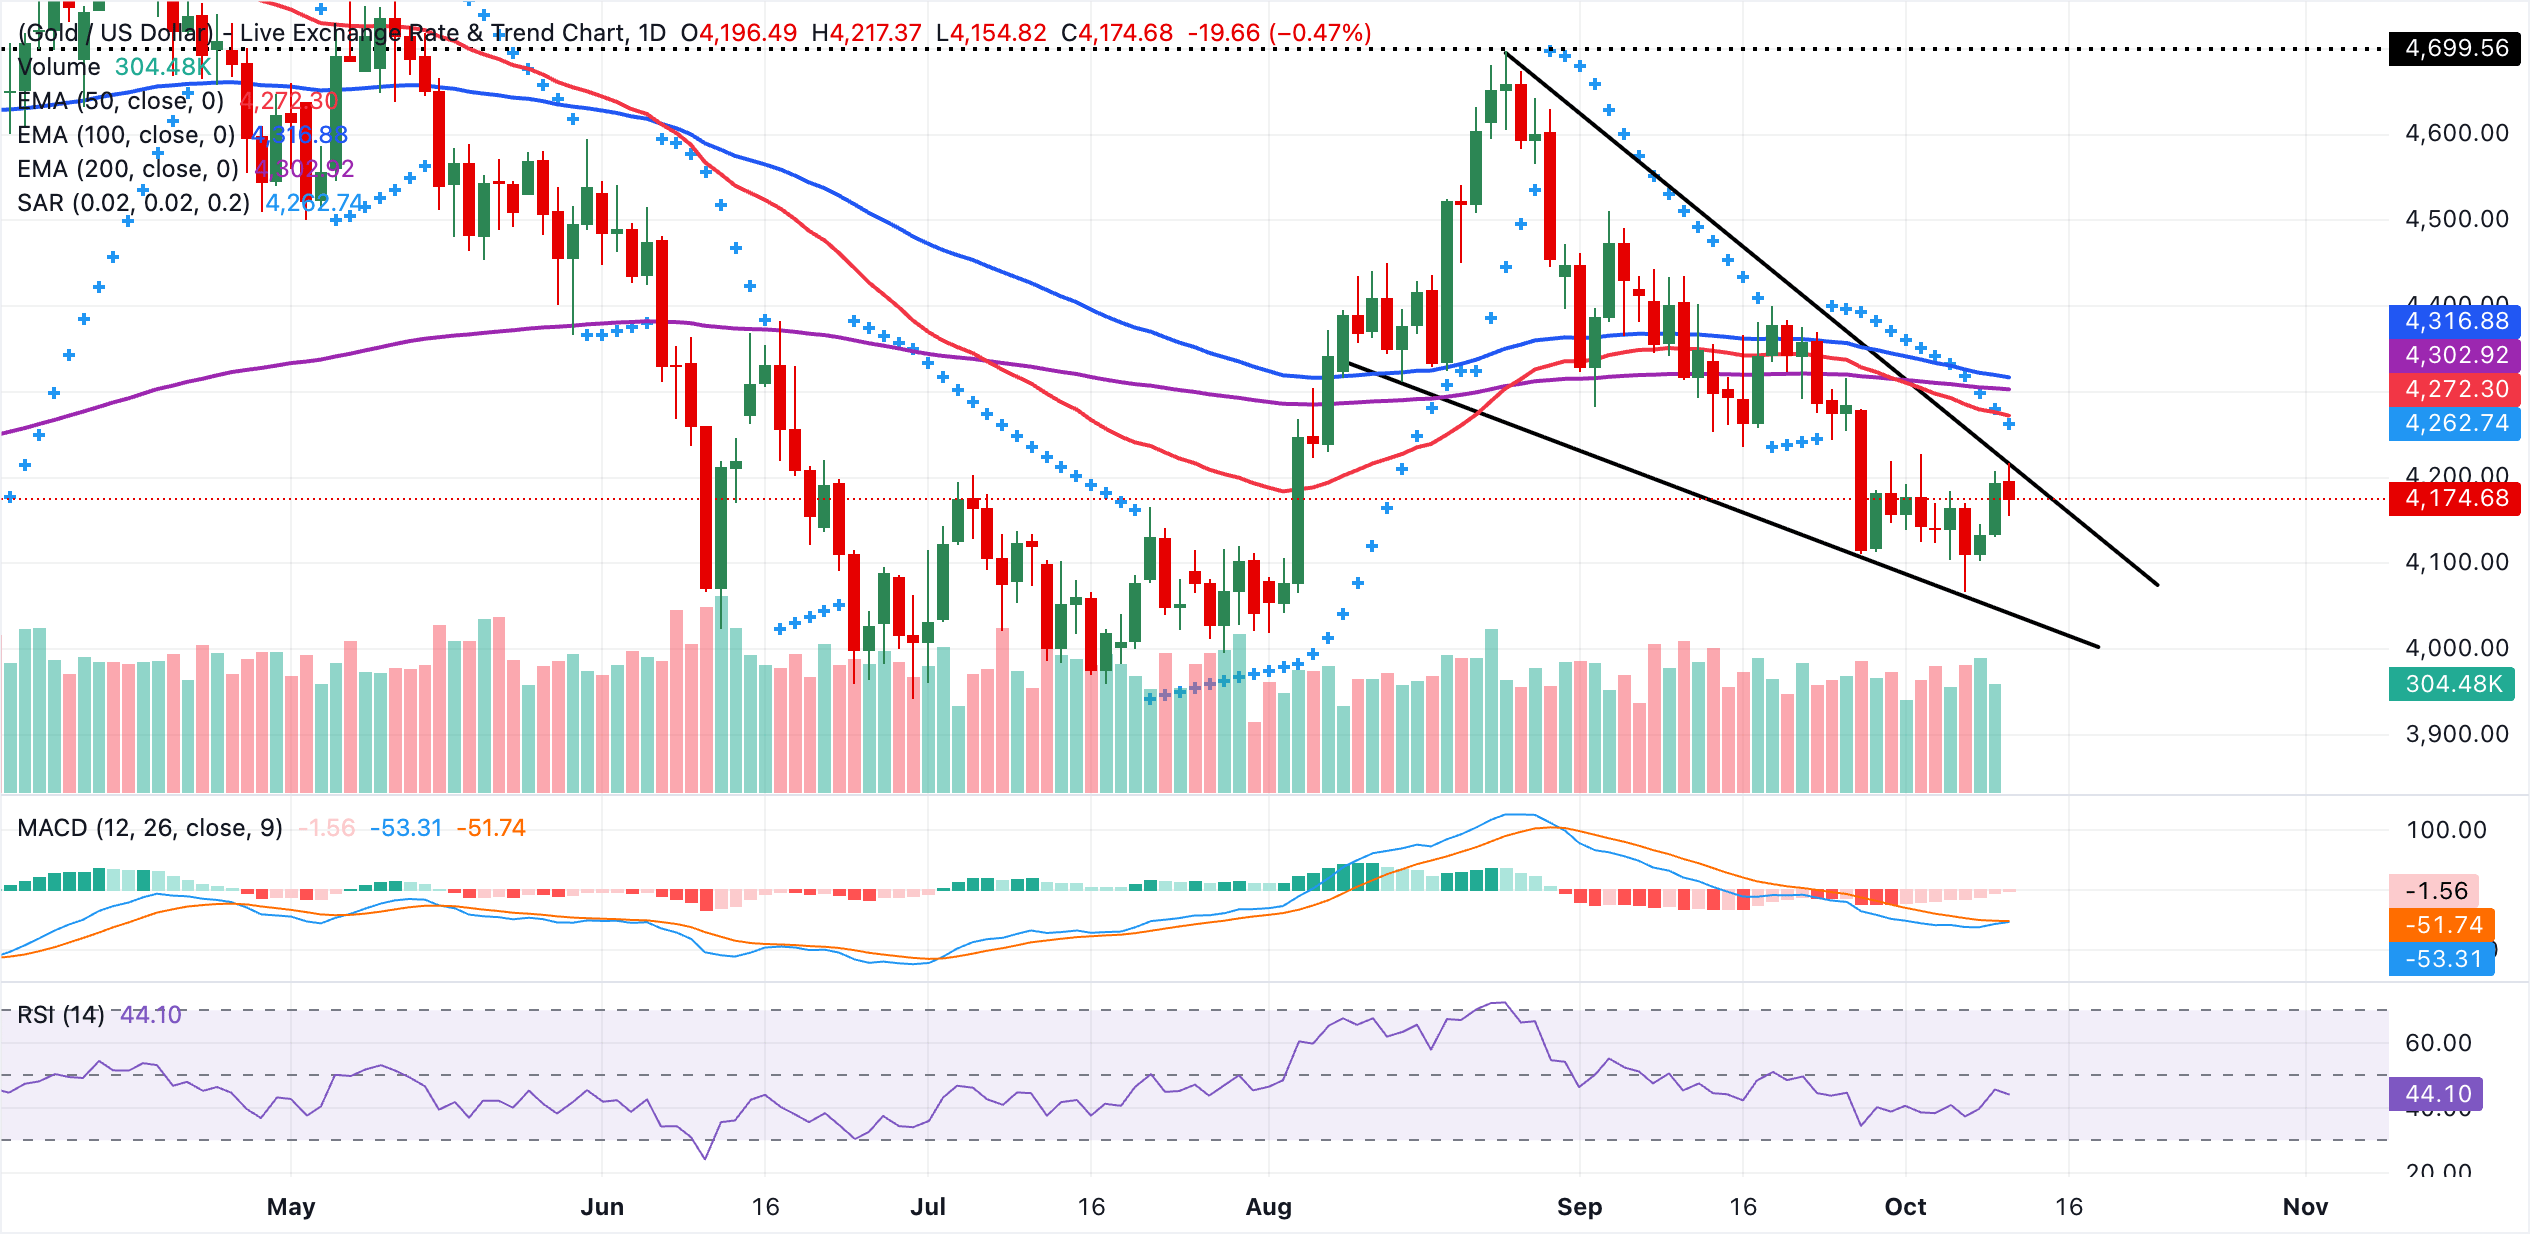
Initial resistance lies at the trendline break level of $4,176, followed by the Parabolic SAR at $4,263 and the 50-day EMA at $4,272. Above that resistance cluster, the 200-day EMA at $4,303 and the 100-day EMA at $4,317 define a broader supply zone that the metal would need to reclaim to ease the prevailing bearish bias.
With no nearby structural support on the daily chart, any pullback to these barriers would leave XAU vulnerable to further downside extension toward the psychological $4,000 demand area, unless momentum improvement in MACD and RSI translates into sustained buying interest strong enough to overcome the clustered overhead resistance.
(The technical analysis of this story was written with the help of an AI tool. Know more.)
Crypto ETF FAQs
An Exchange-Traded Fund (ETF) is an investment vehicle or an index that tracks the price of an underlying asset. ETFs can not only track a single asset, but a group of assets and sectors. For example, a Bitcoin ETF tracks Bitcoin’s price. ETF is a tool used by investors to gain exposure to a certain asset.
Yes. The first Bitcoin futures ETF in the US was approved by the US Securities & Exchange Commission in October 2021. A total of seven Bitcoin futures ETFs have been approved, with more than 20 still waiting for the regulator’s permission. The SEC says that the cryptocurrency industry is new and subject to manipulation, which is why it has been delaying crypto-related futures ETFs for the last few years.
Yes. The SEC approved in January 2024 the listing and trading of several Bitcoin spot Exchange-Traded Funds, opening the door to institutional capital and mainstream investors to trade the main crypto currency. The decision was hailed by the industry as a game changer.
The main advantage of crypto ETFs is the possibility of gaining exposure to a cryptocurrency without ownership, reducing the risk and cost of holding the asset. Other pros are a lower learning curve and higher security for investors since ETFs take charge of securing the underlying asset holdings. As for the main drawbacks, the main one is that as an investor you can’t have direct ownership of the asset, or, as they say in crypto, “not your keys, not your coins.” Other disadvantages are higher costs associated with holding crypto since ETFs charge fees for active management. Finally, even though investing in ETFs reduces the risk of holding an asset, price swings in the underlying cryptocurrency are likely to be reflected in the investment vehicle too.
บทความแนะนำ


