
Cardano Price Forecast: ADA eyes channel breakout as whales’ buying spree outpaces retail investors
- Cardano edges lower within a consolidation range, part of a larger falling channel pattern.
- On-chain data indicate that large investors have purchased over 490 million ADA, while retail investors are offloading in 2025.
- Derivatives data signal a minor surge in Open Interest holding against increased long liquidations.
Cardano (ADA) loses ground by 1% at press time on Tuesday, extending the 0.88% from Monday while maintaining a sideways trend between the 7-day price band. Despite a pullback that has shaken out retail investors, large investors, commonly known as whales, have significantly increased their risk exposure by acquiring 490 million ADA tokens. Meanwhile, both technical and derivatives data signal subdued optimism as Cardano consolidates.
Smart money continues to acquire ADA
Santiment’s ADA supply distribution shows a diverging trend in the holdings of large and retail investors. The holding of large investors with more than 1 million ADA tokens has increased to 23.74 billion ADA, up from 23.25 billion ADA since January 4.
At the same time, the holding of investors with less than 100,000 ADA tokens has dropped to 6.72 billion ADA, from 6.86 billion.
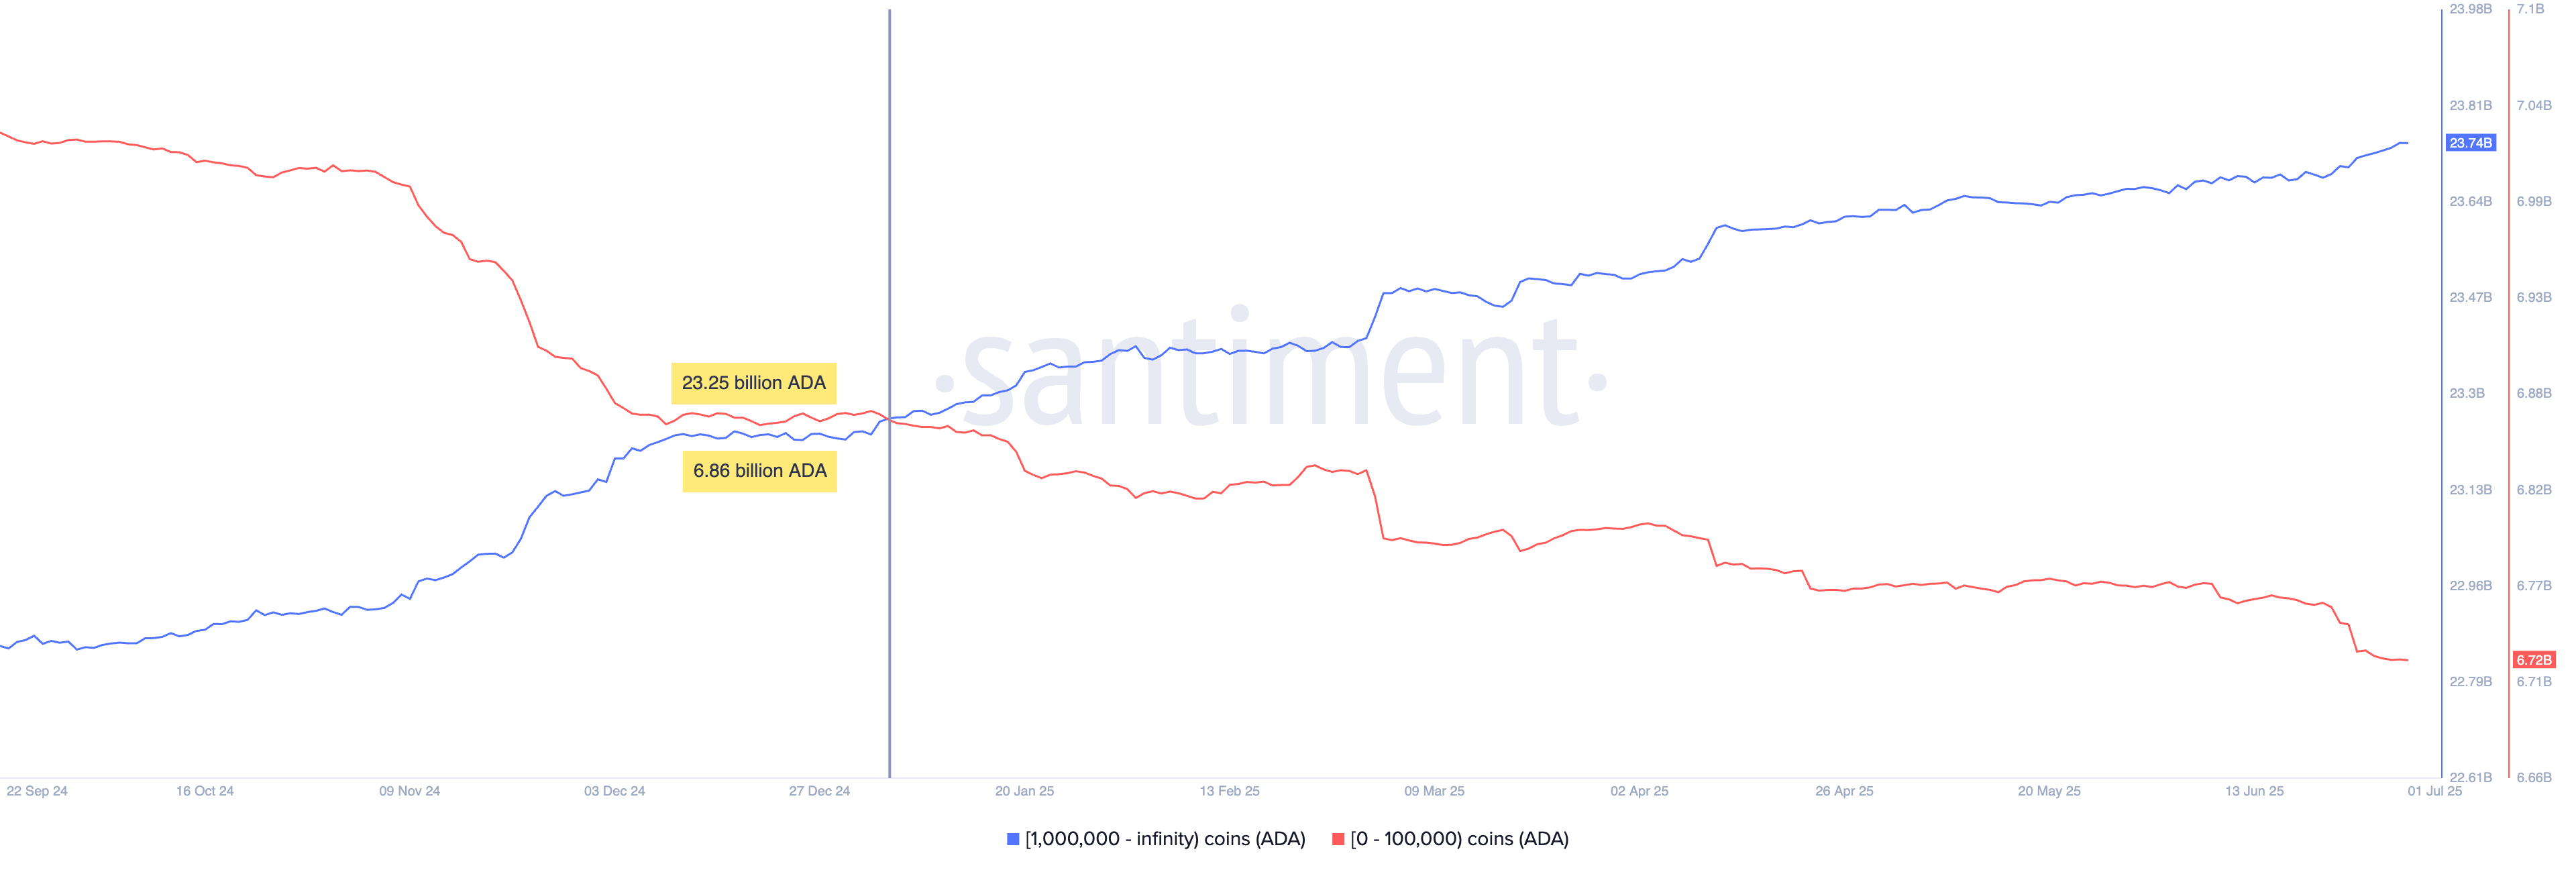
Cardano supply distribution. Source: Santiment
The diverging trend in investors at polar ends of purchasing power aligns with the pullback in Cardano. While retail investors close positions to avoid losses in their low-capital portfolio, the smart money captures the dip.
Optimism holds in ADA derivatives
Coinglass’ data displays a minor 0.68% surge in Open Interest (OI) to $769.92 million. The gradually rising OI relates to increased buying activity in Cardano derivatives.
Adding credence to increased buying, the OI-weighted funding rate increased by 0.0074% to keep the swap and spot prices aligned. Positive funding rates are imposed on buyers to offset the surge in swap prices resulting from leverage exposure.
However, the liquidation data offers a viewpoint to increased wipeout of bullish positions. The long liquidations in the last 24 hours totaled $949.98K, while short liquidations were less than half at $333.06K.
Amid the shakeout of bullish-aligned traders, the long/short ratio drops to 0.9704, suggesting a slightly greater number of active short positions.
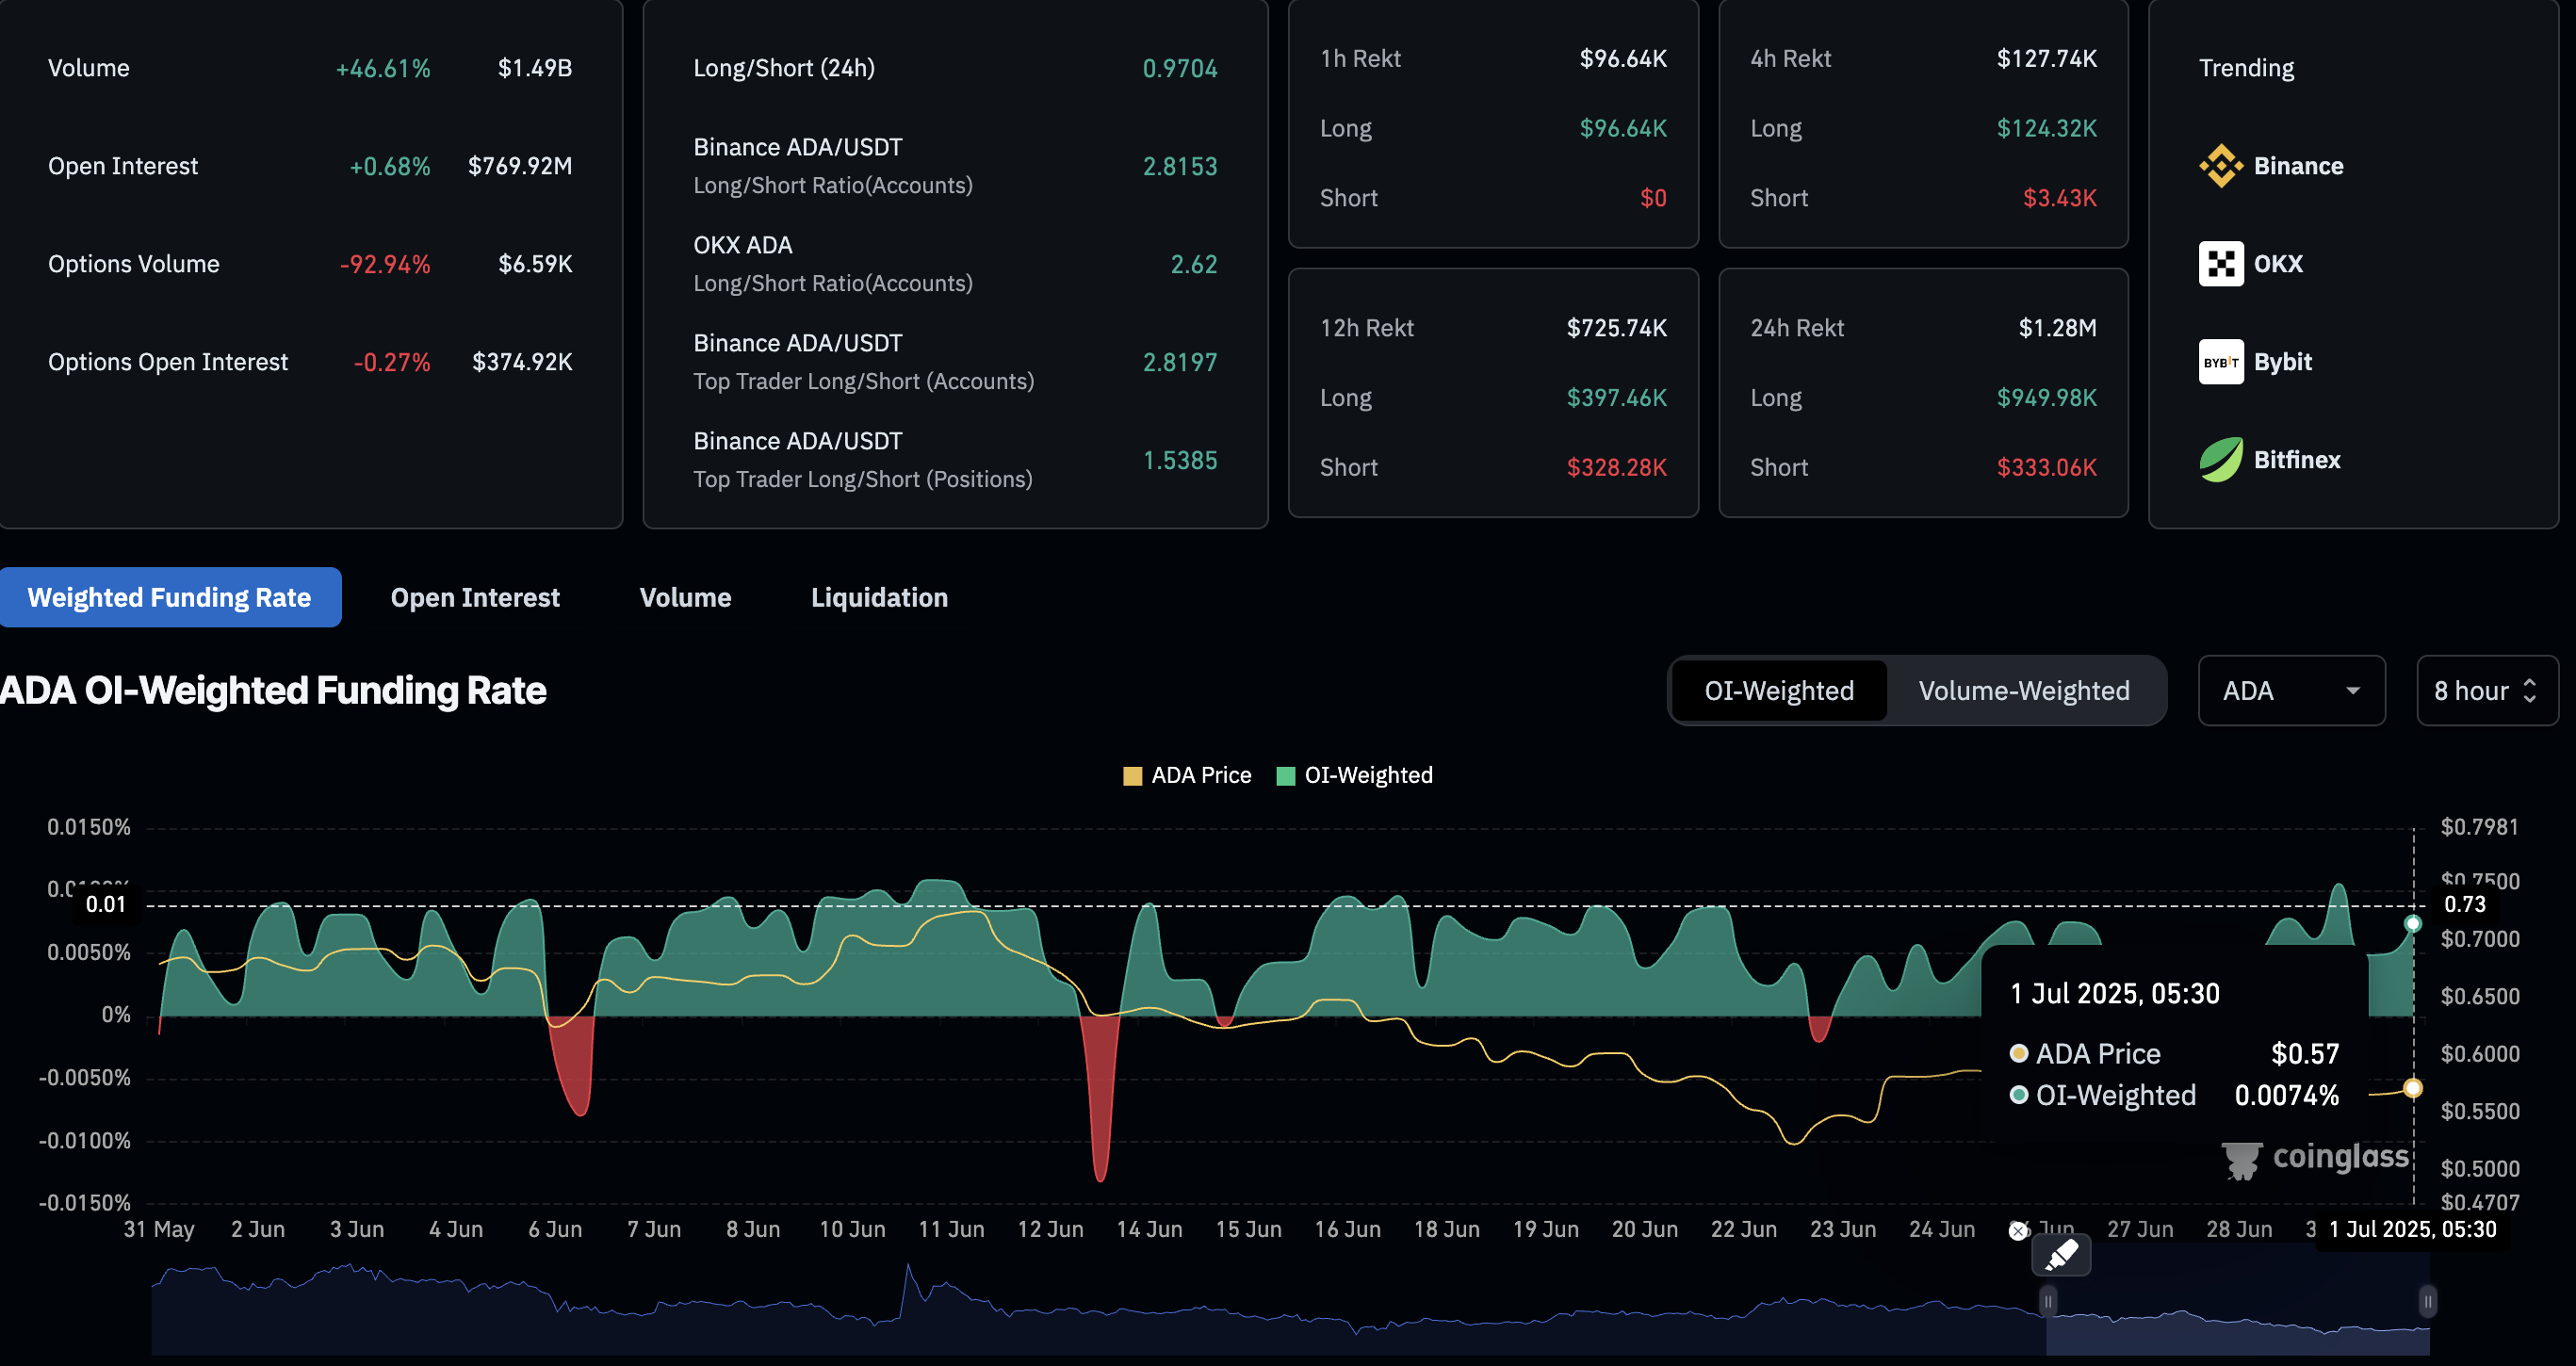
Cardano derivatives. Source: Coinglass
Cardano’s consolidation holds the fate
Cardano is down by 1% at press time following a bearish Doji candle of -0.88% from Monday. Amid pullback, ADA remains trapped in a sideways trend between Tuesday’s high at $0.5939 and Friday’s low at $0.5450.
Further up, a pair of parallel declining trendlines formed by the May 23 and June 10 peaks, while the other formed by the lows of May 19, June 5, and June 23, completing a falling channel pattern.
As the short-term decline nears the $0.5450 support, a close below this could test the lowest point of June at $0.5100, slightly above the channel’s lower boundary.
The Moving Average Convergence/Divergence (MACD) triggered a buy signal on Sunday, marked by a surge of green histogram bars. An uptrend in the MACD line crossing above its signal line supports the bullish signal.
Still, the Relative Strength Index (RSI) at 37 floats at an area above the oversold boundary line, suggesting a bearish tilt in momentum.
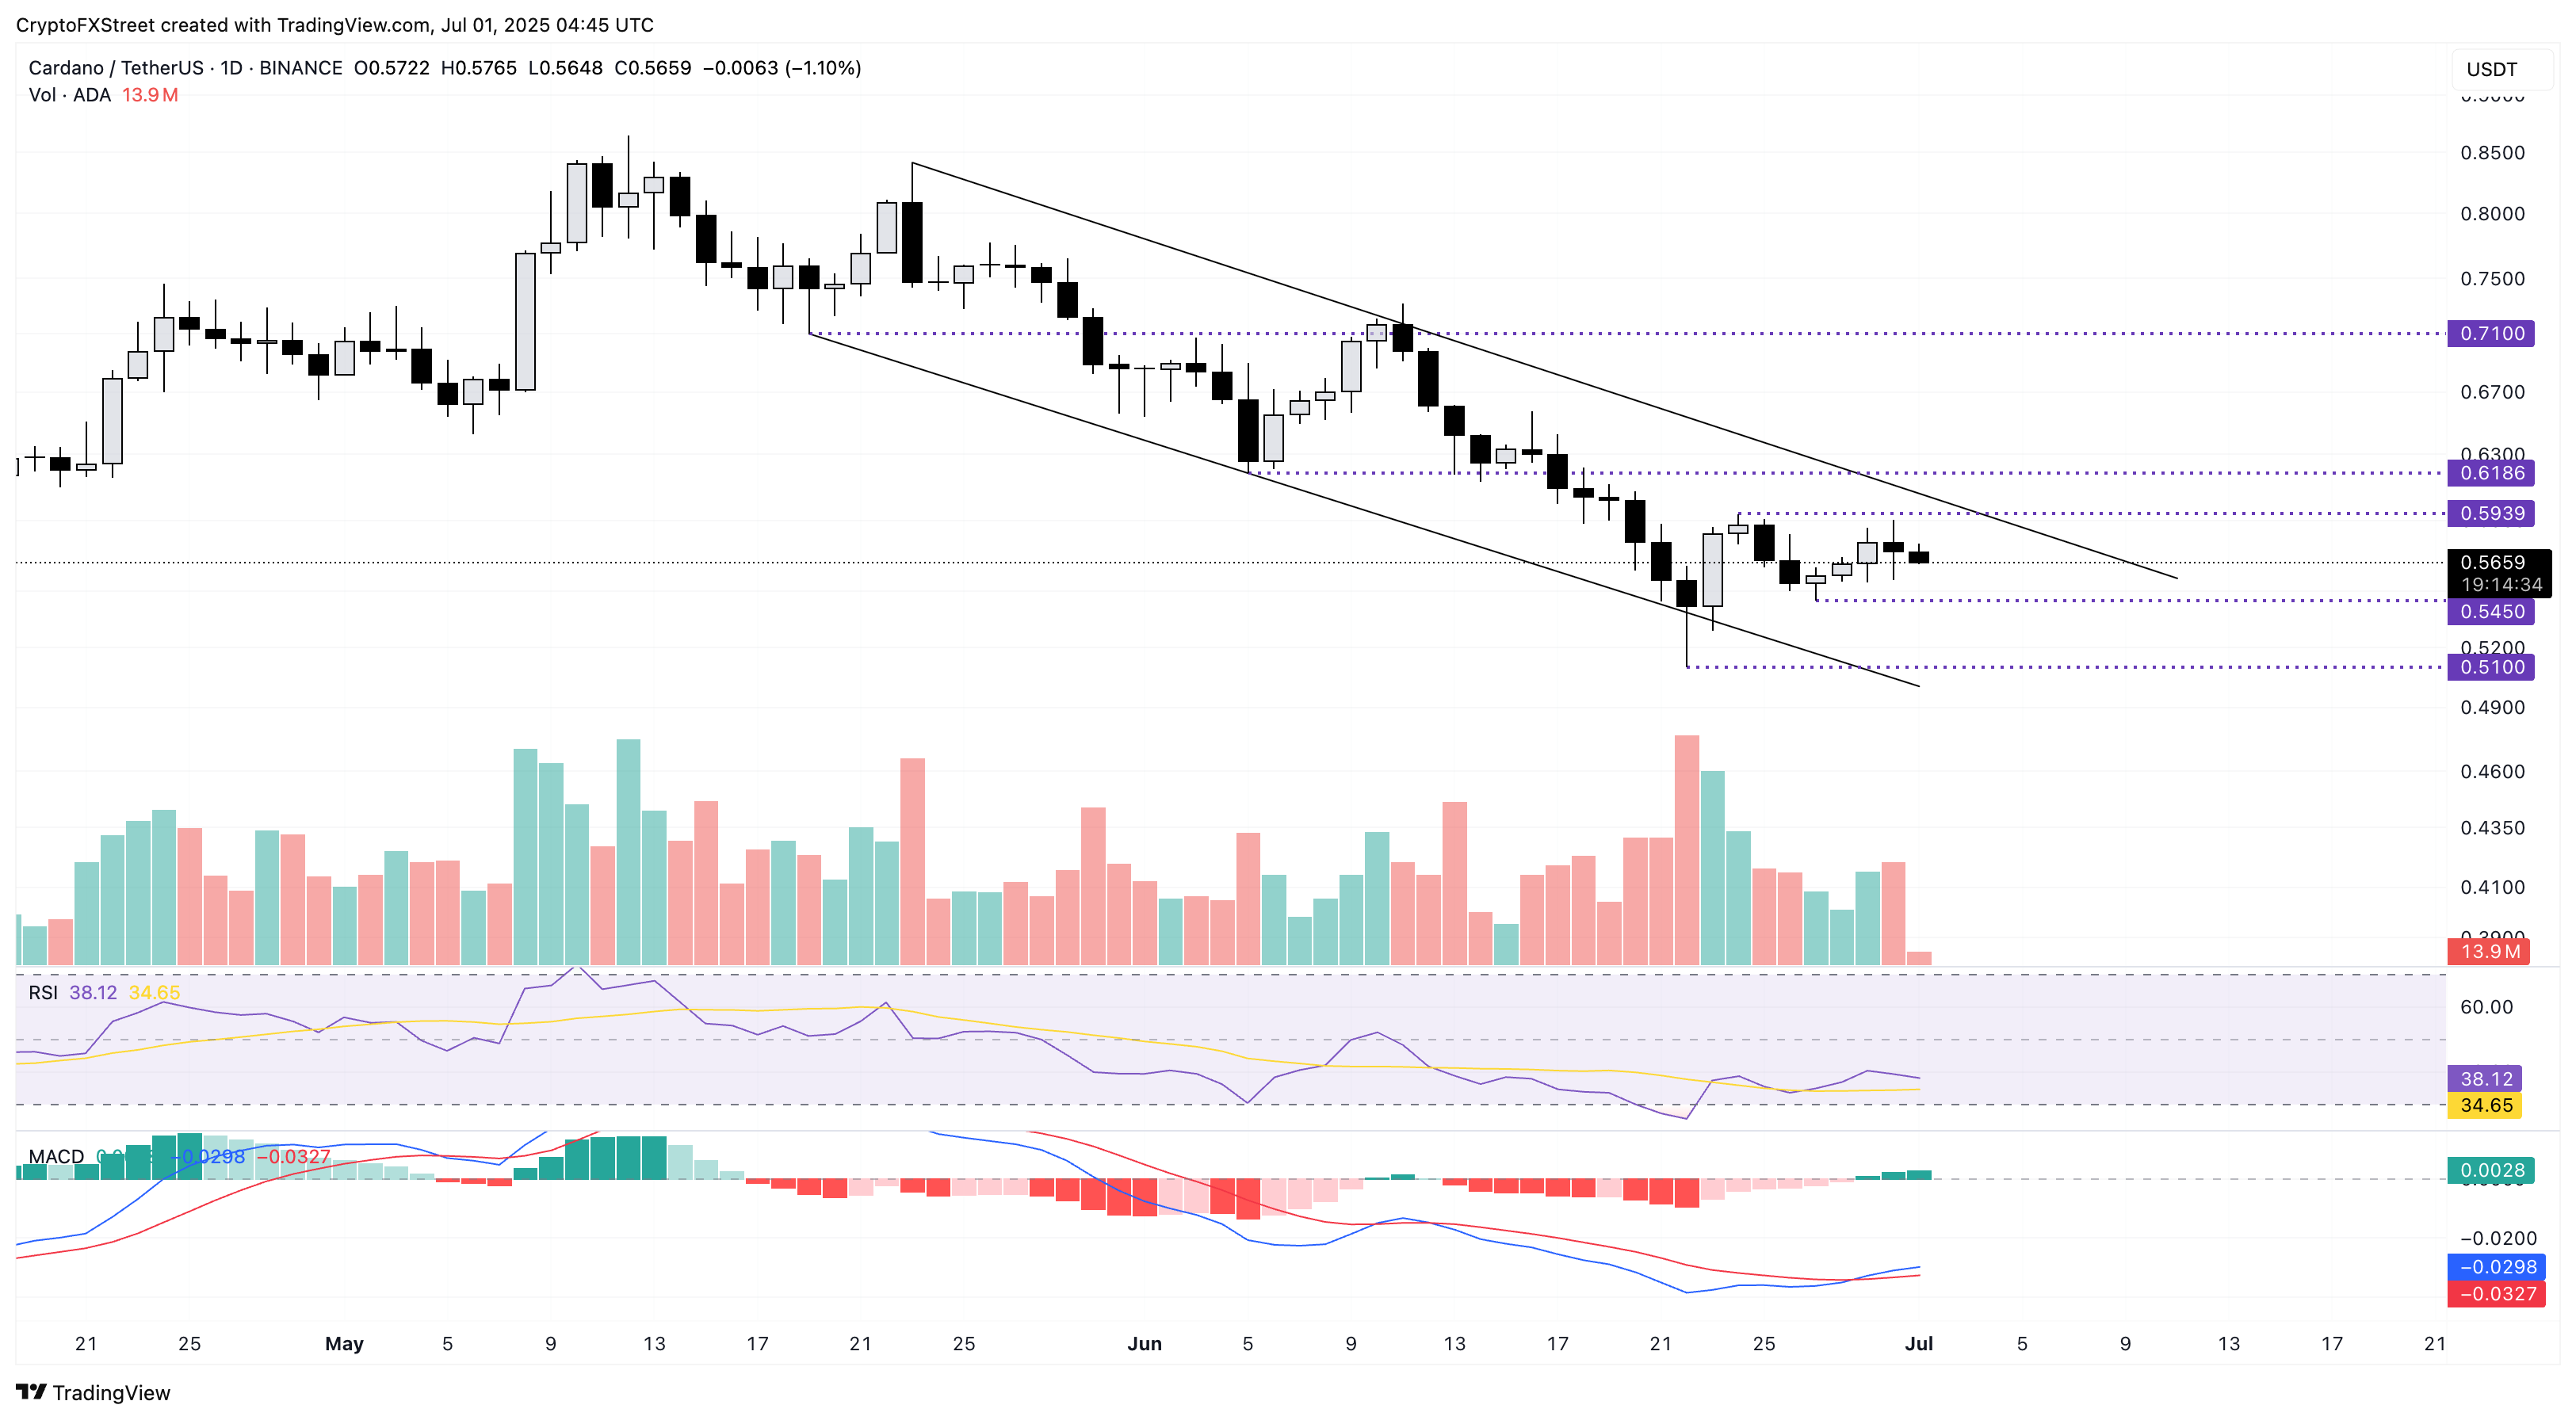
ADA/USDT daily price chart.
To reinforce an uptrend, Cardano must close the overhead trendline coinciding with Tuesday’s high at $0.5939. In such a scenario, the breakout rally could target the $0.6186 level, last tested on June 14.
บทความแนะนำ


